From time to time we are asked to help identify the differences between two databases. For example, the differences between a database in QA and the same database in production. Over the years I have become accustomed to using a very nice tool by Red-Gate, SQL Compare. With the release of Azure Data Studio and the SQL Server Schema Compare extension, I now have another option. As with many of the extensions, this one is also in preview.
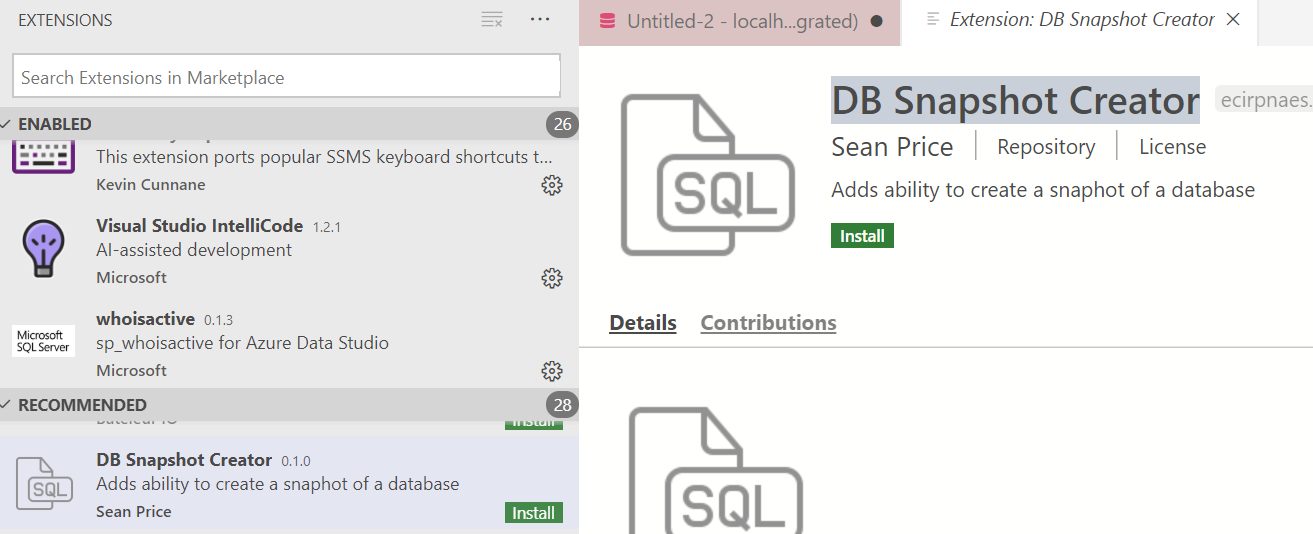
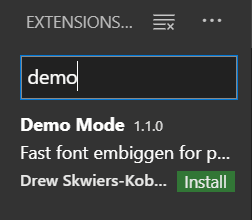
In order to install the extension, after opening the extensions in Azure Data Studio, you will want search for Schema Compare, similar to the image below. Notice the white star in the upper left corner, this means that this extension is recommended by Azure Data Studio.
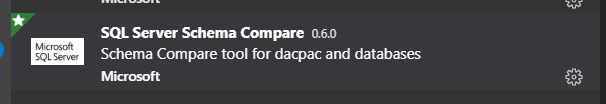
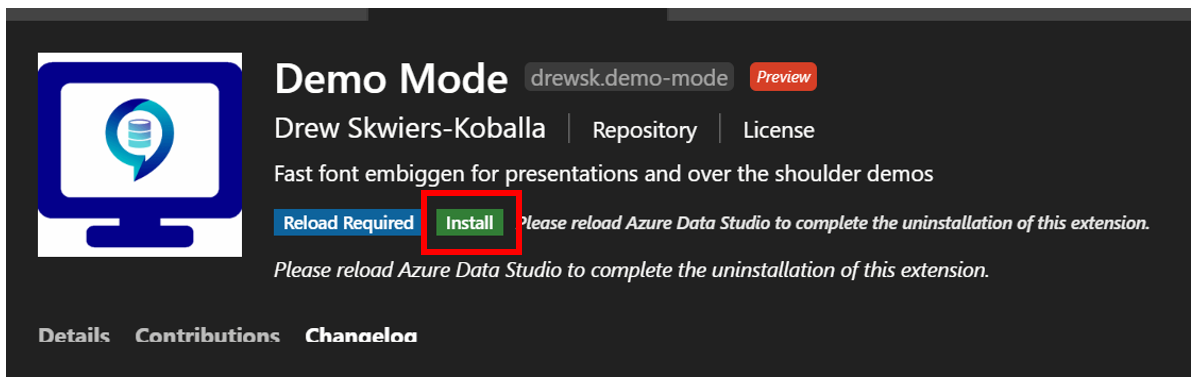
Installation is very easy, once you have found the Schema Compare extension, click the Install button. This is a pretty quick install and does not require a restart of Azure Data Studio.
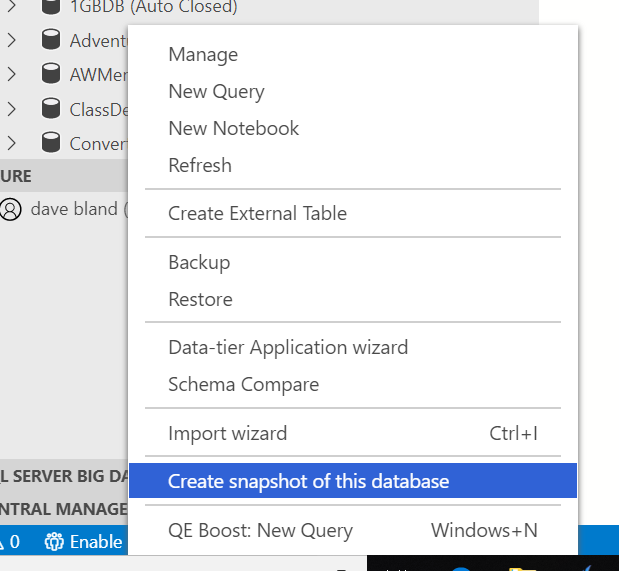
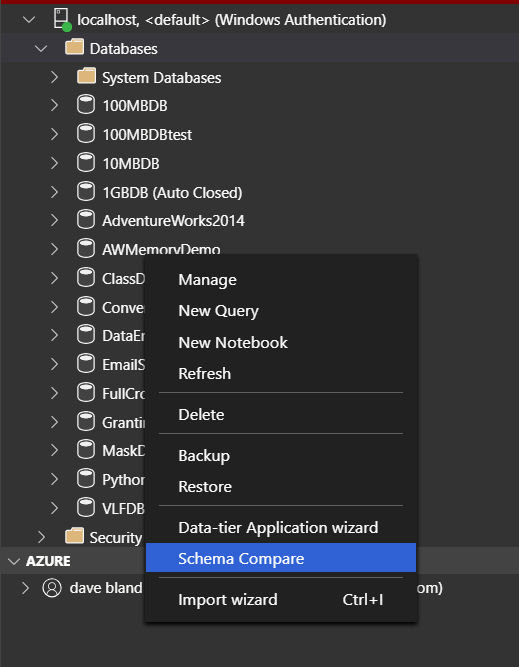
Once installed you can launch the Schema Compare extension in one of two ways. The first way is to right click on one of the databases you wish to compare and go to Schema Compare in the context menu.
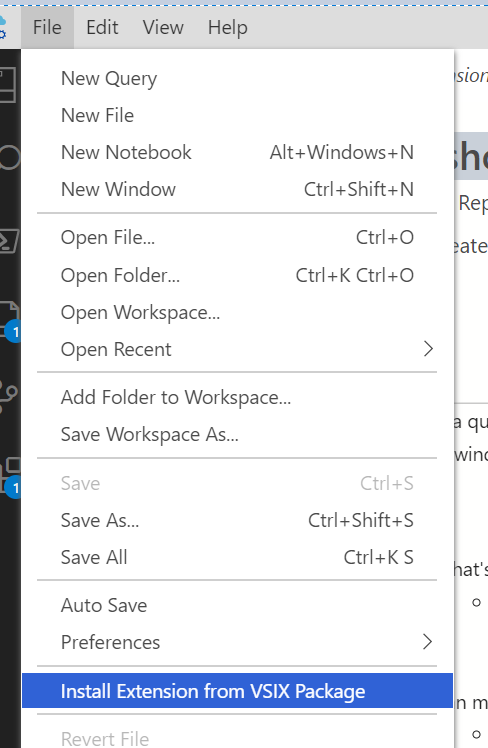
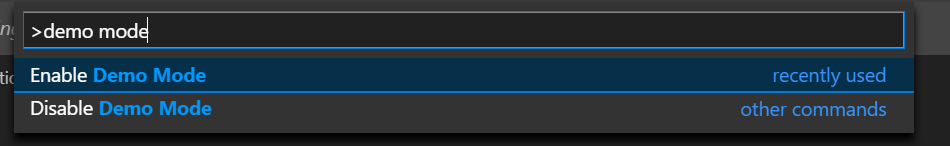
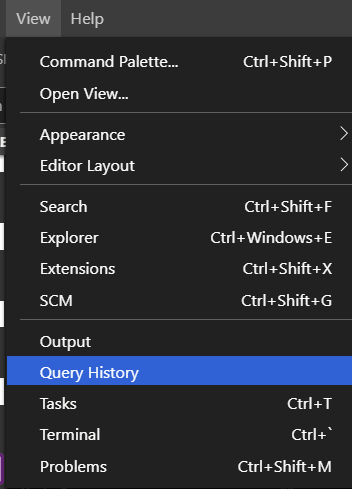
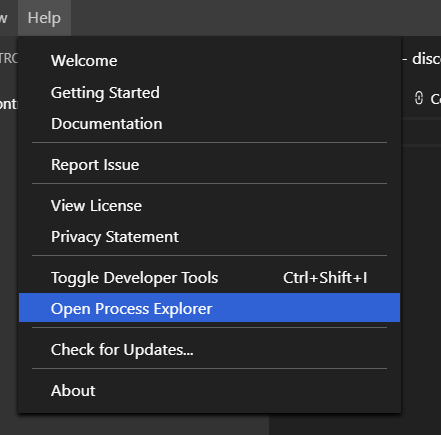
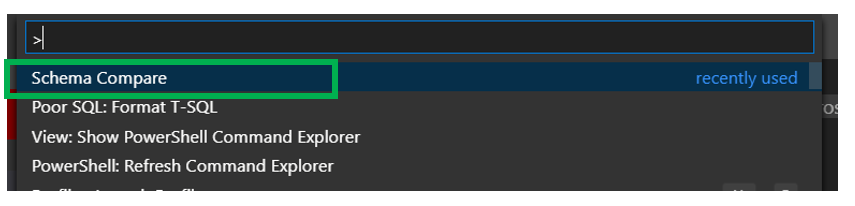
The second method is to use the Command Palette. You can reach this from the View menu.
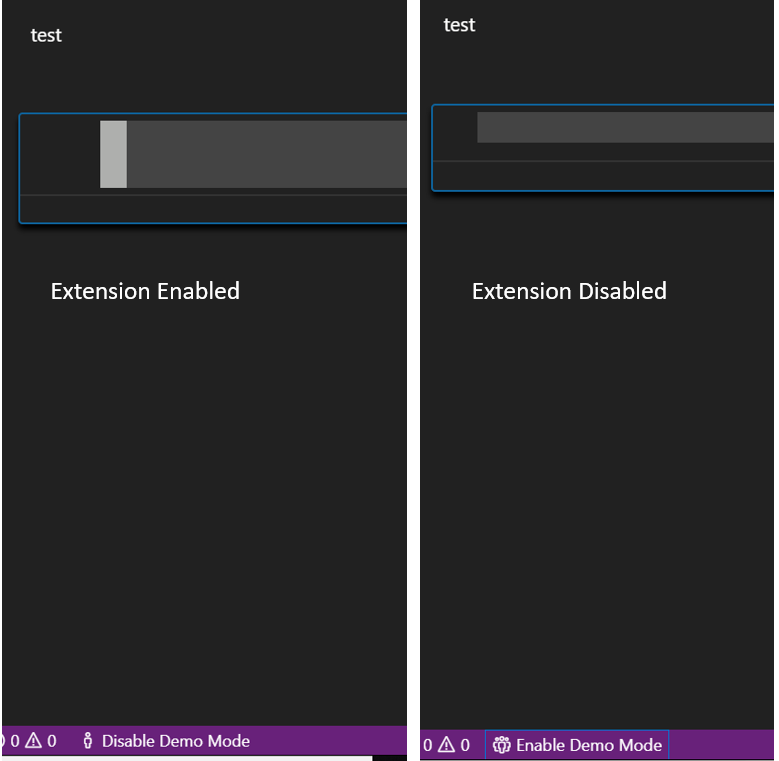
The difference between the two is that if you use the Command Palette, both the source and target locations will be empty. If you right click on a database to compare, that database will be the source and the target will be empty.
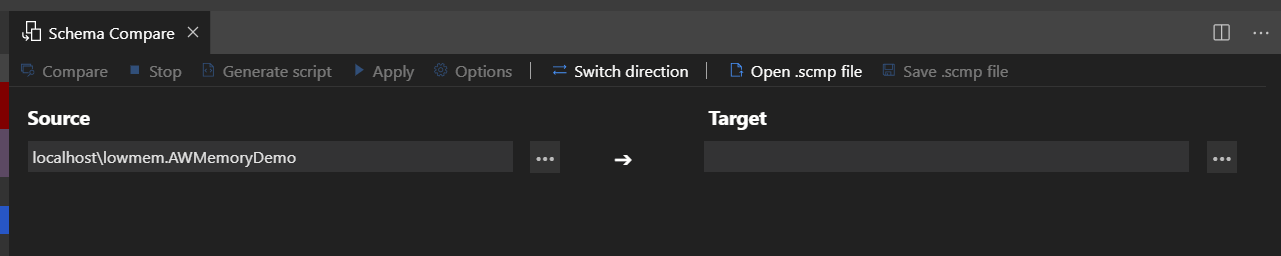
Using the Command Palette – notice both the source and destination are blank.
Right clicking on a database – the source is already populated with the database you right clicked on.
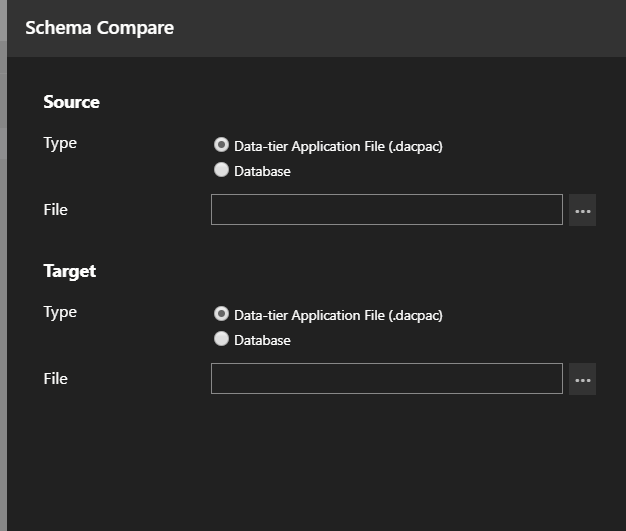
Setting up the Source and Destination
When setting up the source and destination, you will have a choice to make. Will you compare a database or will you use a DACPAC to complete the compare? You don’t have to just compare two databases, you can compare a database and a DACPAC if you have a need to do so. When you click the ellipsis to the right of either the source or destination, you will be taken to the location that will let you set up the comparison.
What I like is that I don’t have to do a database to database compare or a DACPAC to DACPAC compare. Schema Compare allows for a database to DACPAC compare as well. Once set up your screen will something like what you see below.
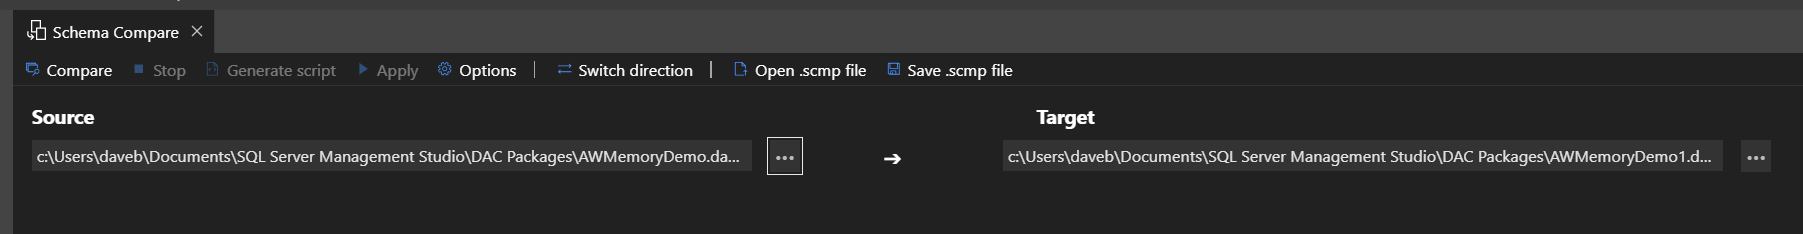
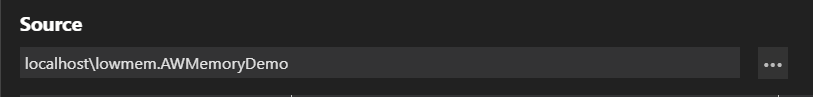
Since I am comparing two DACPACs, there is a path, however if either the source or target is a database, it will look similar to below. The format is ServerName.databasename. In this case since I am using a named instance it is slightly different, ServerName\InstanceName.DatabaseName.
Menu Options
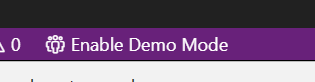
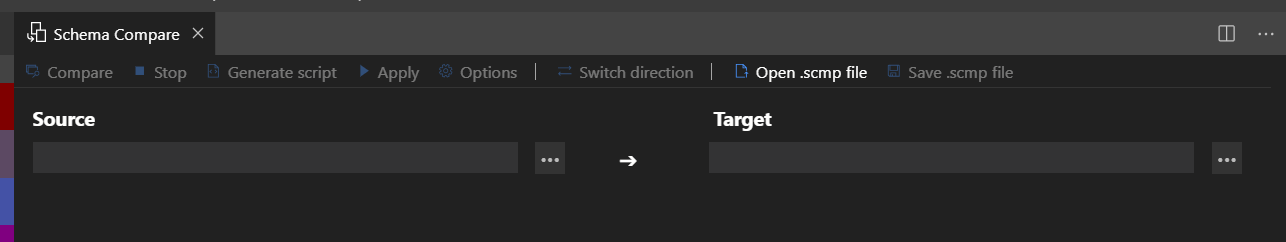
Once you have set up the source and target, the menu bar will appear across the top.

Let’s take a moment to go over each of these.
Compare and Stop – these are pretty simple and are used to start the compare or stop it.
Generate Script – Once the compare is done, we can use this to generate the script we can use to make the changes. Notice in the image above this is not active. It will become active after you have completed the compare AND you are comparing two databases. You will not be able to use this option when comparing two DACPACs.
Apply – Will apply the discovered changes to the target
Options – There are a number of options that include rules to follow, like “Block on Possible Data Loss” and what to include in the compare. “Ignore Permissions” is an example.
Switch Direction – This will take the source and make it the target…and of course take the target and make it the source. When you click this, the arrow between the two will stay pointing to the right, the items to compare will move.
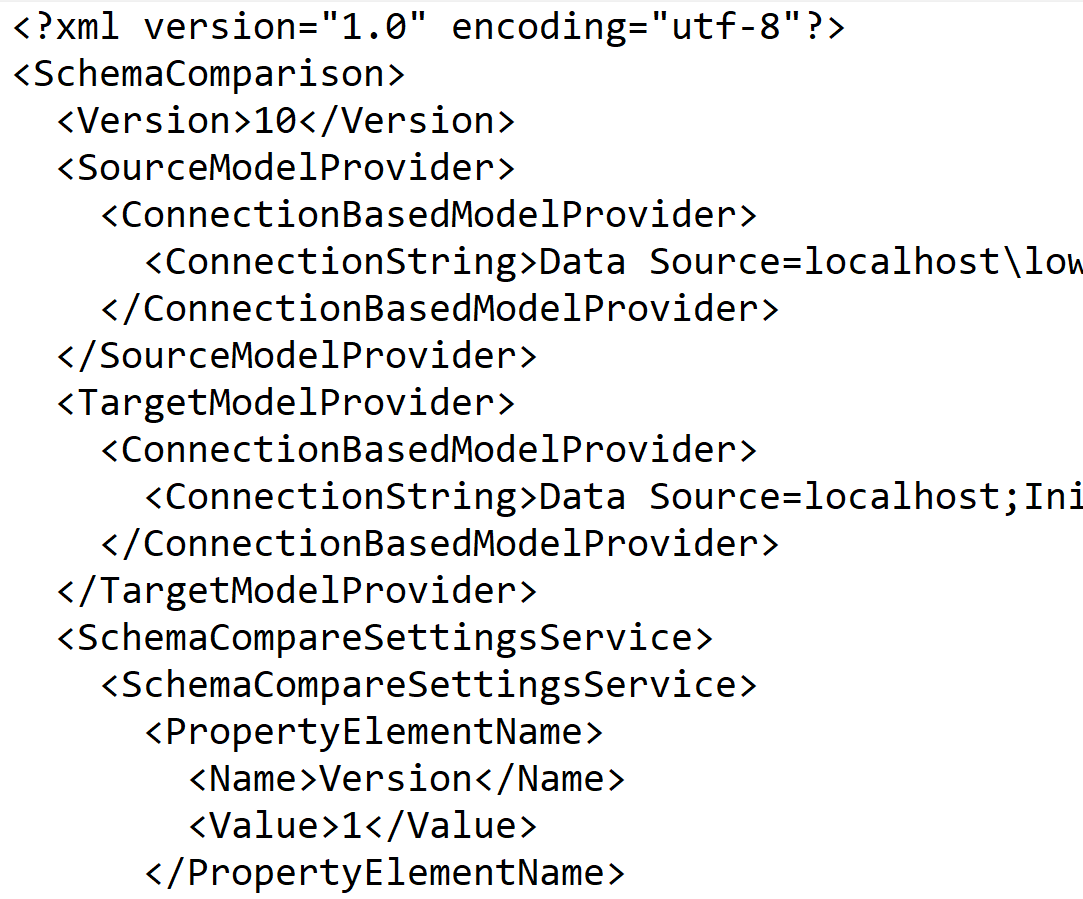
Open .scmp\Save .scmp – Schema Compare allows you to save the configuration to run the compare again at a later date if you like. If you save it after the compare is completed, this will NOT save the results of that compare. These files are XML based and will look similar to below. The format is pretty simple, the XML will contain the version, source, target and the current state of all the options.
Changing Target or Source
Once the target and source are set up, you can easily change one or both of them. Simply click the ellipsis again, make the changes you want and click “OK”.
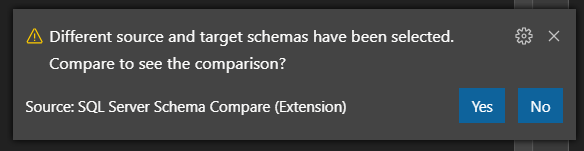
When you do make a change and click “OK” the following will appear in the lower right corner of Azure Data Studio. It is just asking if you want to complete the compare now. If you click no, you will still be able to complete the compare by clicking “Compare” when you are ready.
Generate Script
This does exactly as you would expect it to. It generates the script. Once the compare is complete, as in the image below, the Generate Script option becomes active. Just a reminder, if both the source and the target are DACPACs, generating the script is not an option.
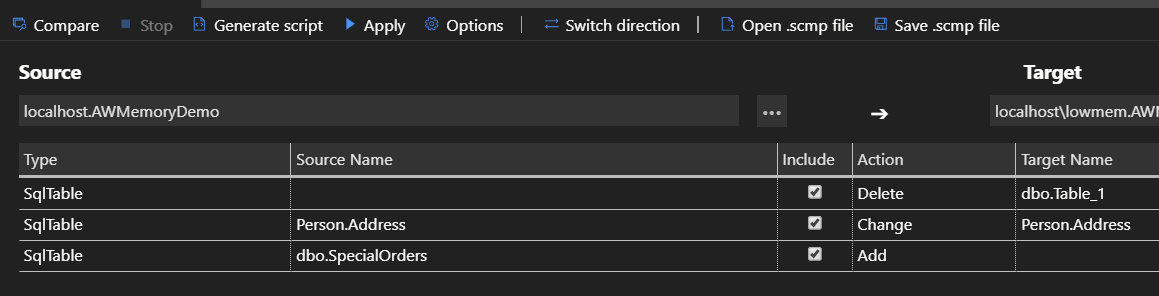
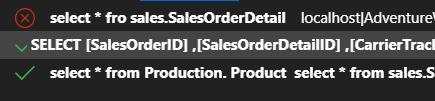
Prior to generating the script, you will want to review what was found, specifically the Include and Action columns to make sure those are indeed the changes you would like to make. If there is a difference you do not want to be part of the script make sure to clear the check box in the include column. Once Azure Data Studio is completed with the generation of the script a new table will open up. This tab will not be connected to a data source. If you want to run it, you will need to connect to the desired data source.
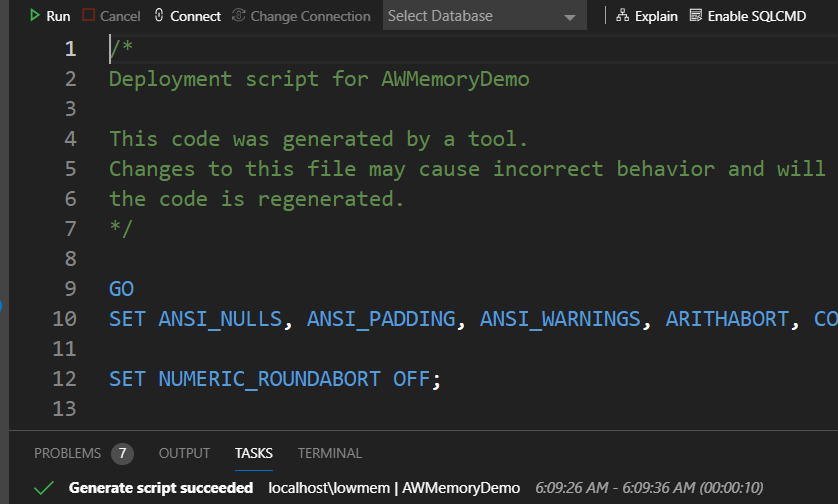
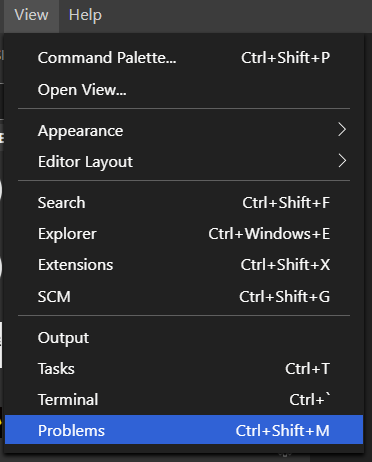
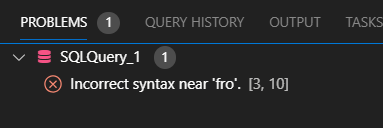
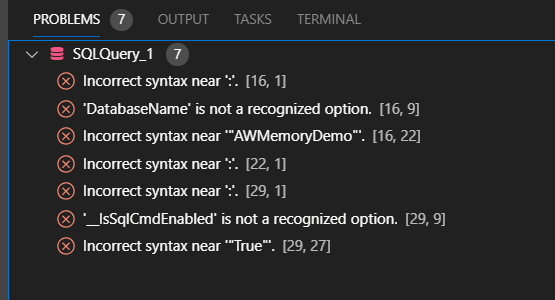
Notice in the bottom left corner of the above image you see “Problems” with the number 7 to the right of it. Initially you might think that Azure Data Studio created bad code, that is not the case. When you click on “Problems” you will see a list of the problems as well as the line number and the location of the first character of the problem. If you click on one of the problems, you will be taken to that location.
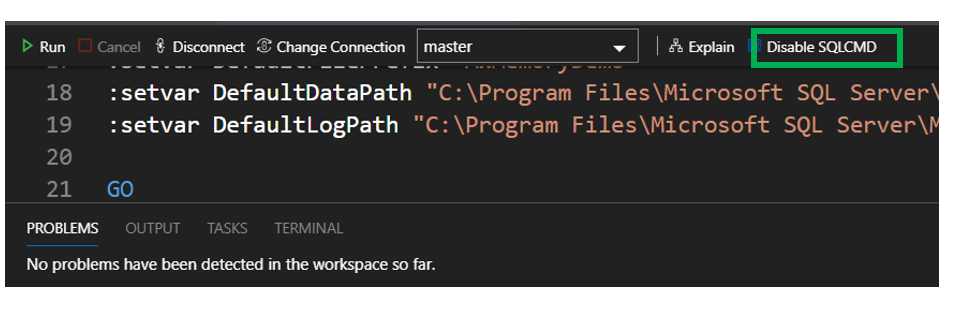
You still might be thinking ADS created bad code. Now I will show that the code is just fine. If you look at the code and scroll down just a bit you will see this.
“Detect SQLCMD mode and disable script execution if SQLCMD mode is
not supported.“
The code that is generated requires that SQLCMD be active. Once SQLCMD is active, the problems disappear.
Now you are able to run the script when you are ready. Of course, the script can be saved as a .sql file if you want to run it later.
I think this is a very useful warning that can be found near the top of the generated script.
“This code was generated by a tool.
Changes to this file may cause incorrect behavior and will be lost if
the code is regenerated.”
Just something to think about before making any changes.
Options
The final item I would like to cover is the Options button. Of course this is exactly what you might think it is, a location to set options.
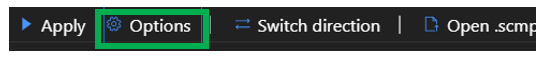
When you do click this, a panel will open up on the right side of Azure Data Studio. At the top of this panel you will see two options.
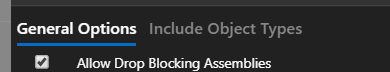
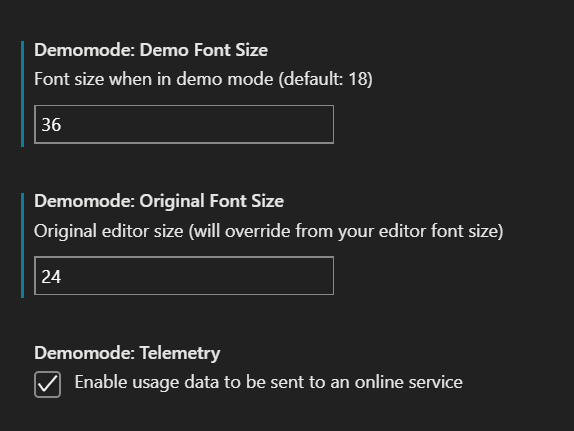
The first options is “General Options”. This is where you can identify what you actually want to capture in the compare. While the second option will identify the object types you want to be looked at, for example tables, views or stored procedures.
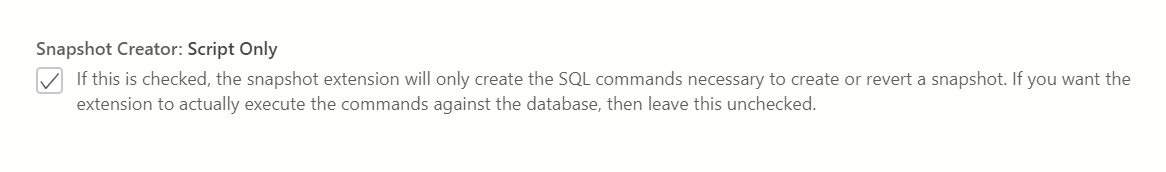
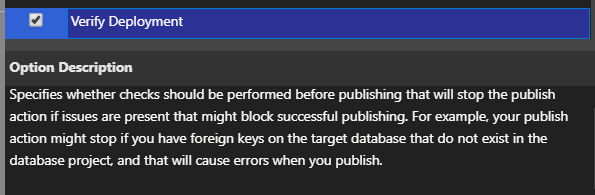
Under the General Options there is one in particular I would like to point out, Verify Deployment. Having this checked, the deployment will not be allowed to proceed if the validation detects a problem. The image below is the actual description you will see.
As time goes on we will use this extension more and more, we will then have a better understanding of some of the additional options we might want to include. You should really check this extension out!
Thanks for visiting my blog!!
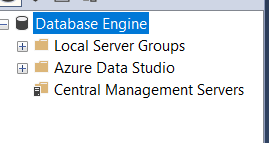
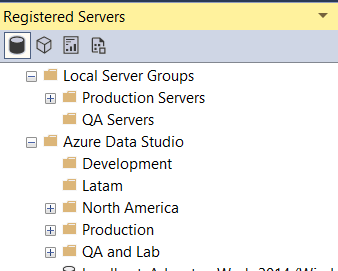
 You do not need to restart Azure Data Studio to see the new group in the Connections pane. However, you will need to restart SQL Server Management Studio to see the new group in the Registered Servers window.