DEADLOCK_PRIORITY

When two processes are caught up in a deadlock, one will be chosen as the victim and the process will be terminated, while the other process will be successful.  SQL Server will, by default, pick the process that has the lowest cost to rollback.  This can present a potential issue if the terminated process is a business critical process.  The DEADLOCK_PRIORITY allows us to have more control over whether or not a process is chosen as the victim.

Before getting into how to set the DEADLOCK_PRIORITY, let’s quickly go over what the options are.  There are two ways to set the priority of a process. The first option is to use one of the keywords, LOW, NORMAL or HIGH. The second approach is to use a numeric value between -10 and 10.  The lowest value will be chosen as the victim.  For example, LOW will be the victim of the other process is HIGH and -1 will be the victim if the other process is greater than -1.

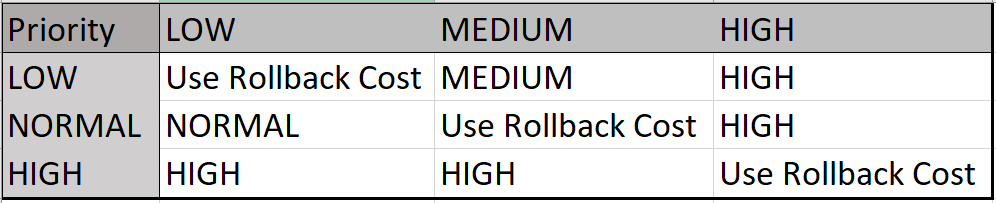
If you look at the chart below you will see the winners and the losers in the deadlock. These charts identify what process will be allowed to complete and not be the victim.  As you can see, when one process is LOW and the other is MEDIUM, the LOW process will be the victim.  If there is a tie, SQL Server will use the cost to rollback the transaction.

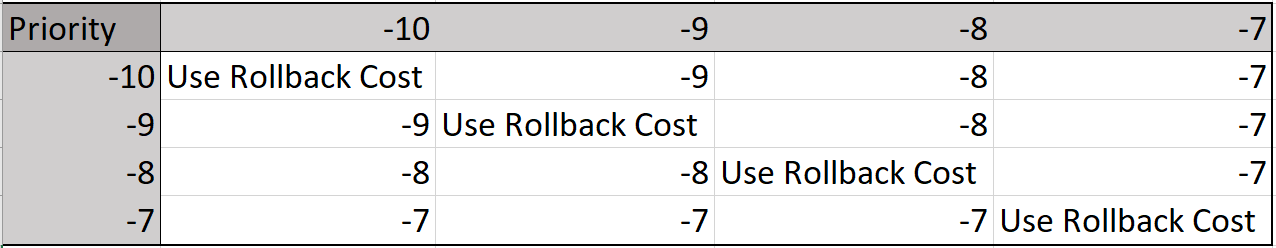
The chart below is somewhat incomplete.  The allowable ranges for the priority as a numeric value is the range between -10 and 10.  As you can see below, if one process is -9 and the other is -7, the -9 will be the victim.  Rather than take the chart all the way out to 10, I think this gives you the idea of how to figure it out beyond the numbers that are in the chart.

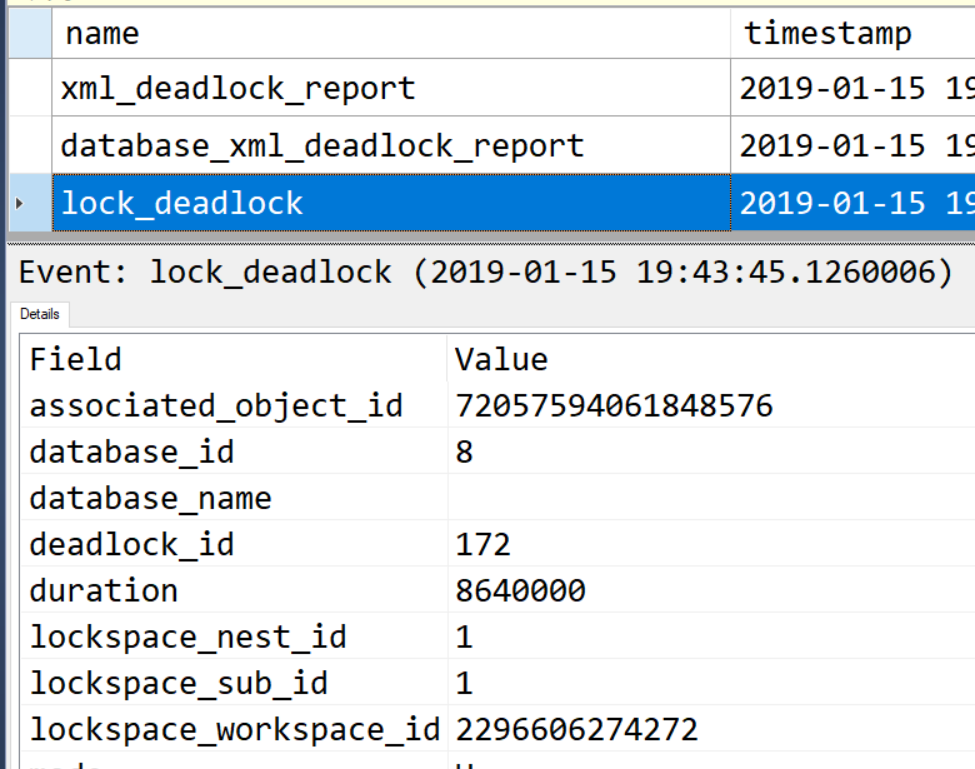
So now that we know how SQL Server determines the victim, let’s take a look at how we can determine what the priority was for the processes in a deadlock.

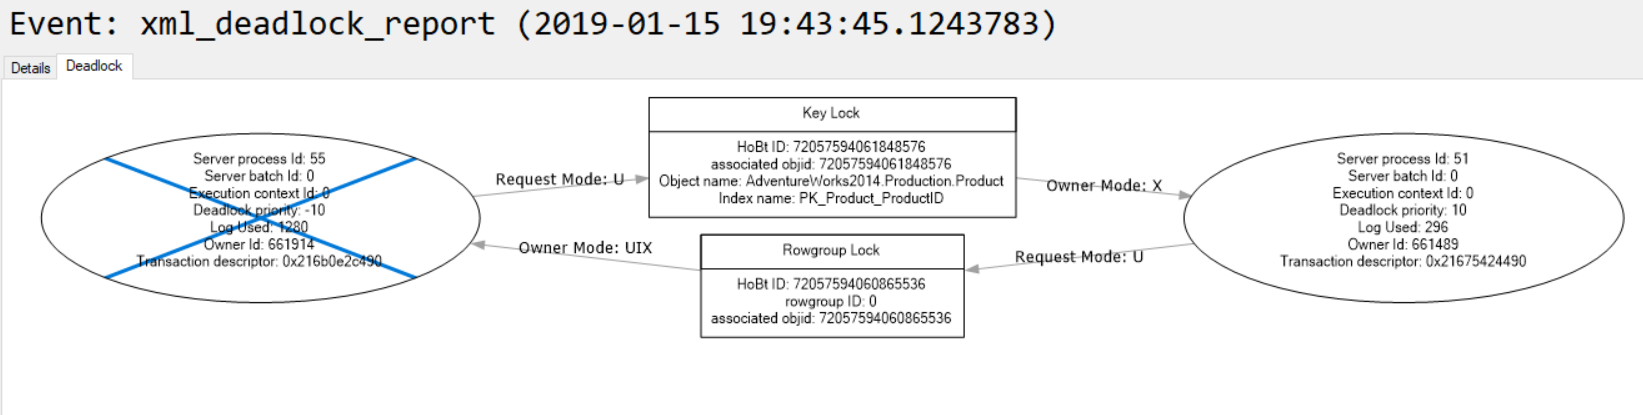
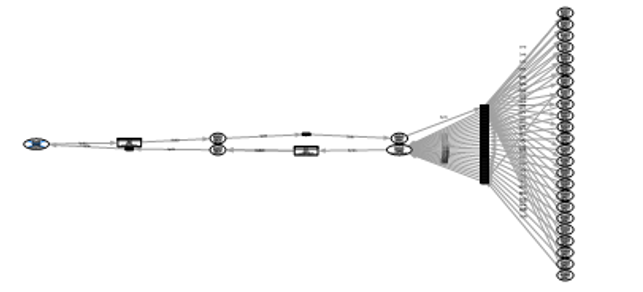
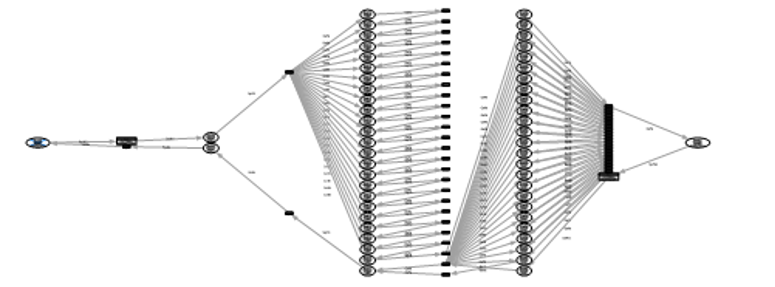
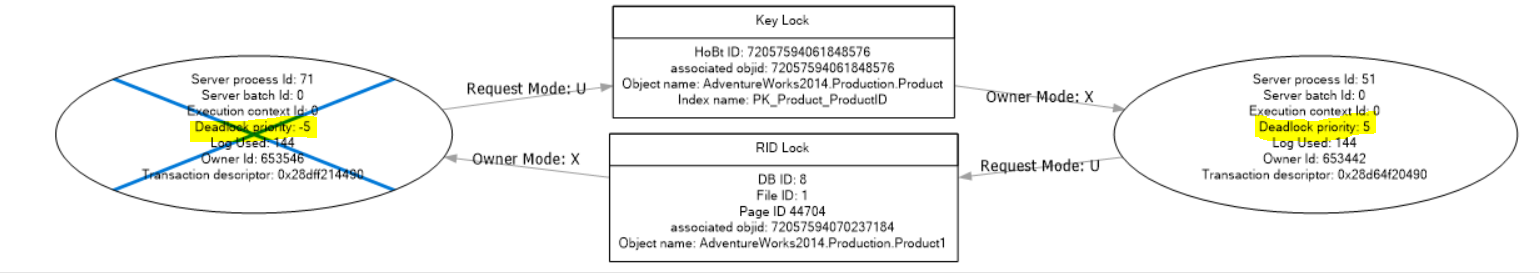
One way is to use the deadlock graph.  The two highlighted items are the deadlock priority for each of the processes.  As you can see, the priority 5 survived while the priority -5 was chosen as the victim.

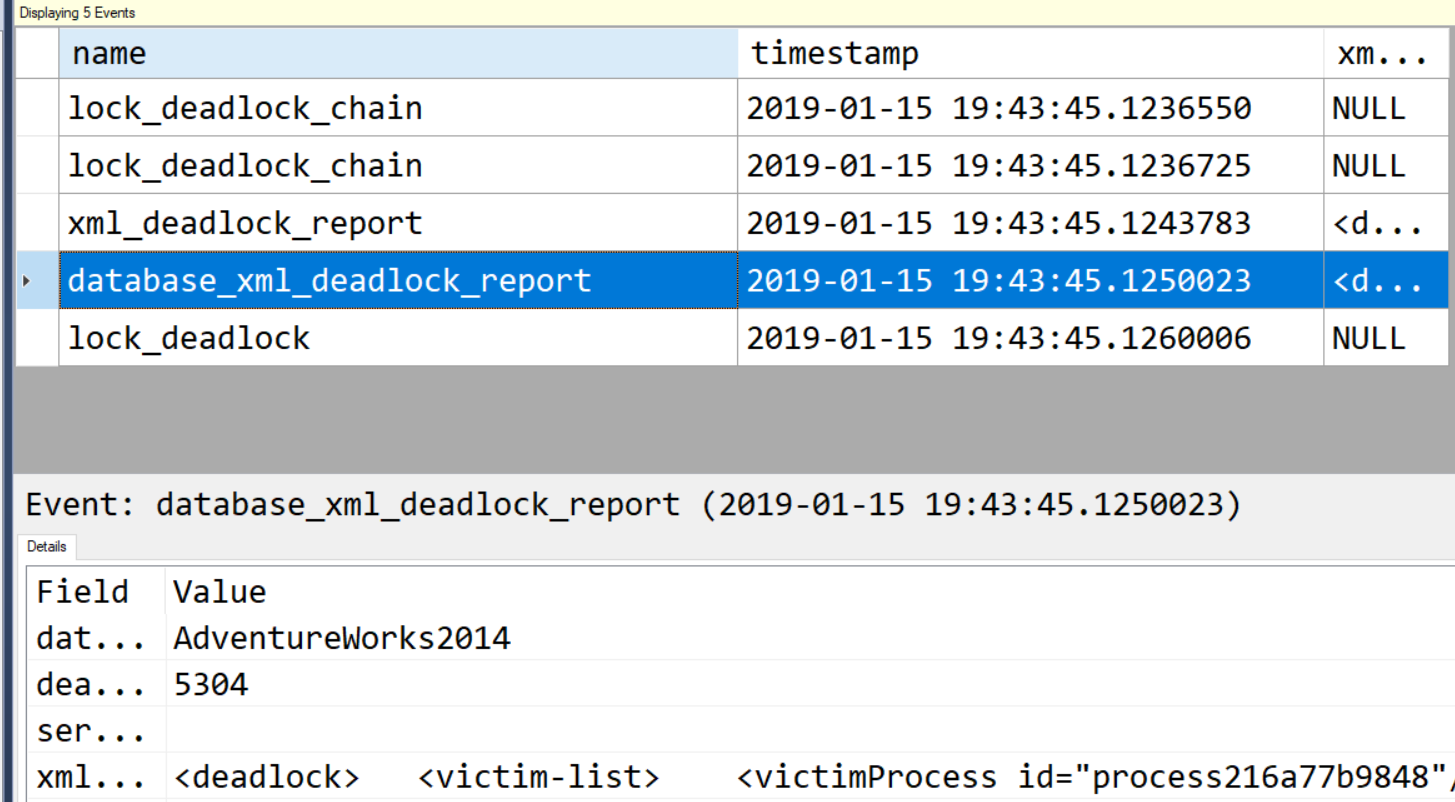
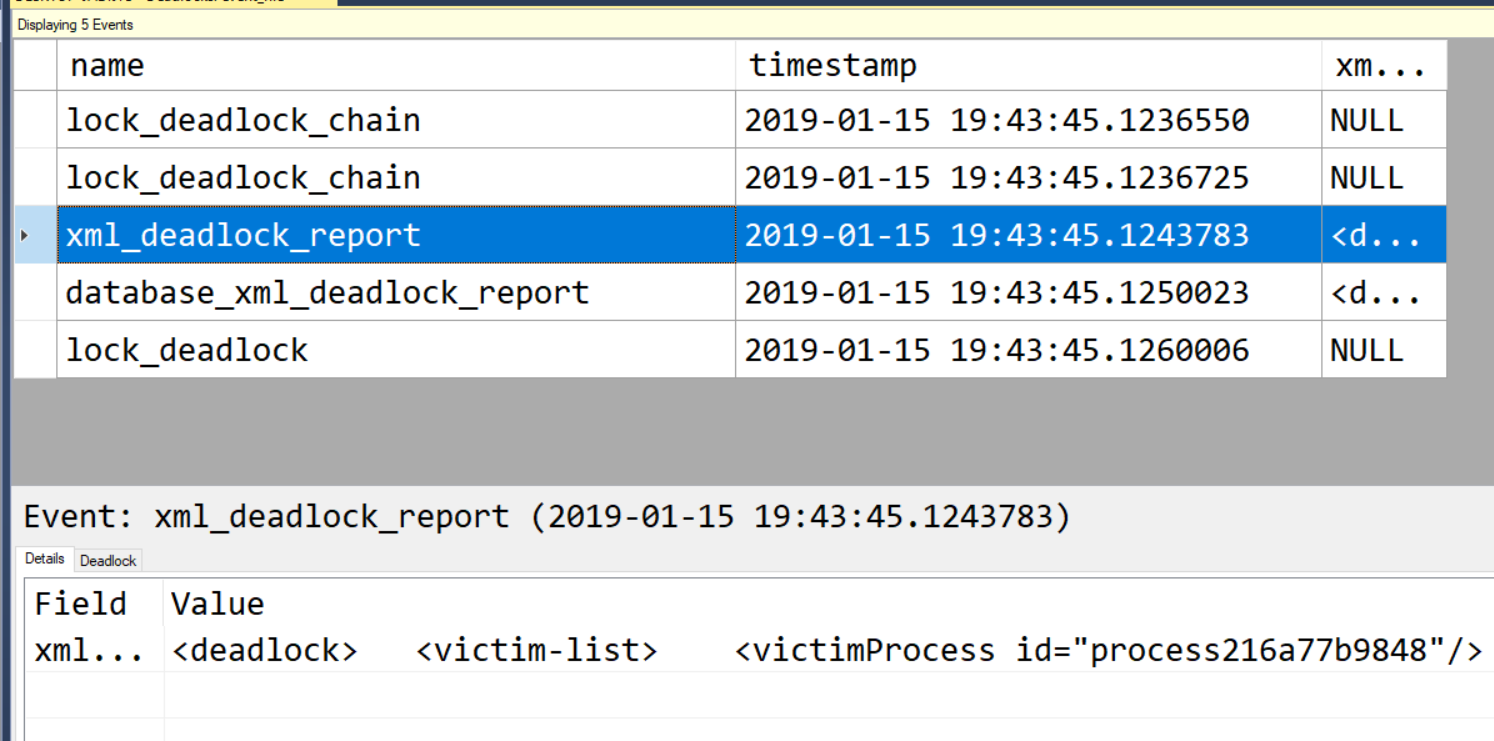
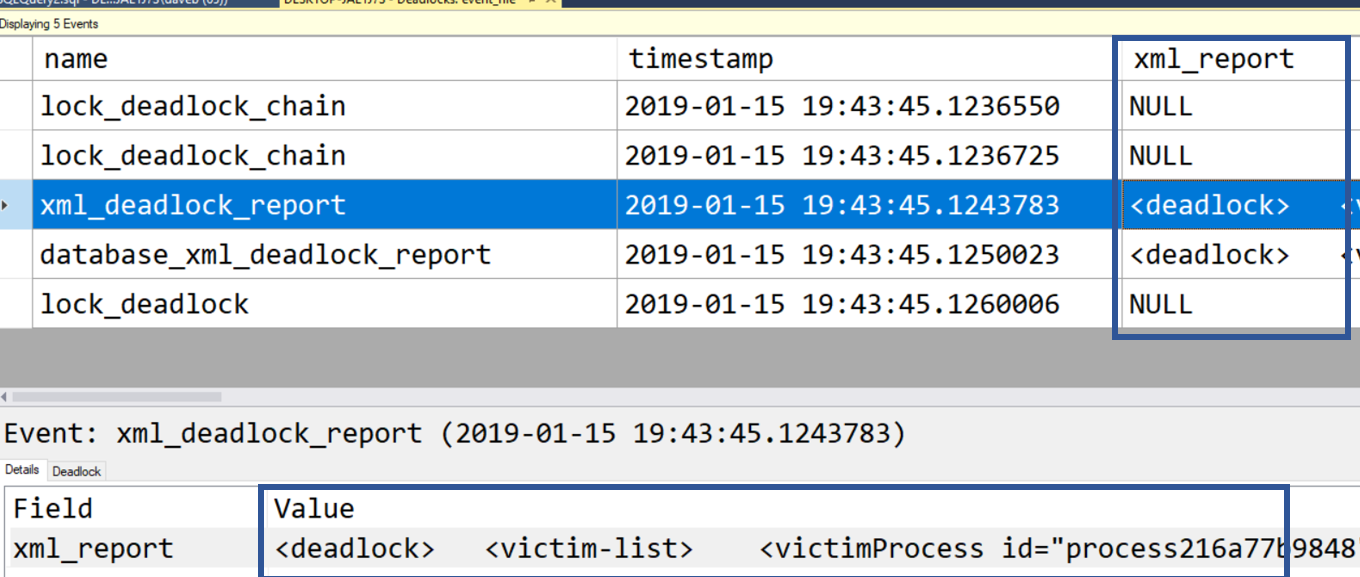
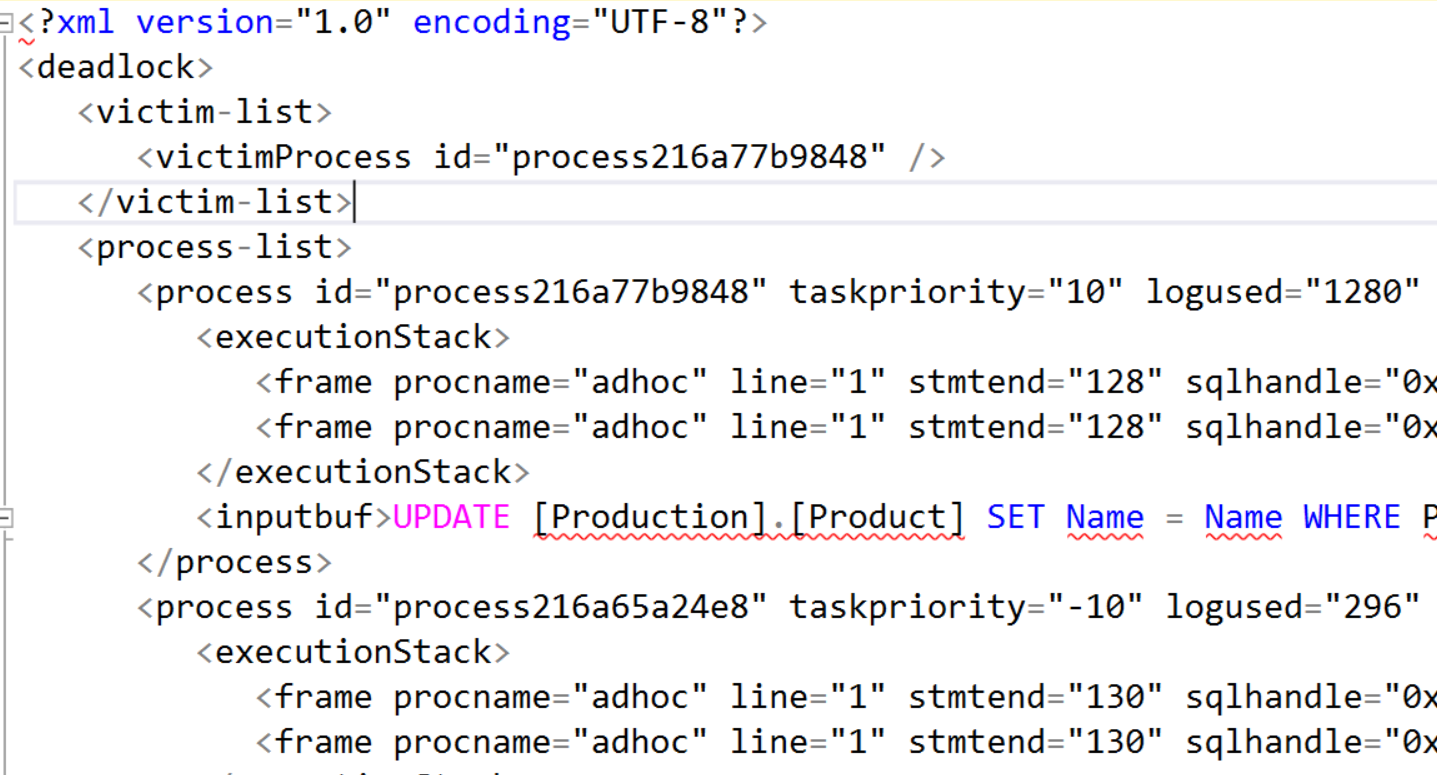
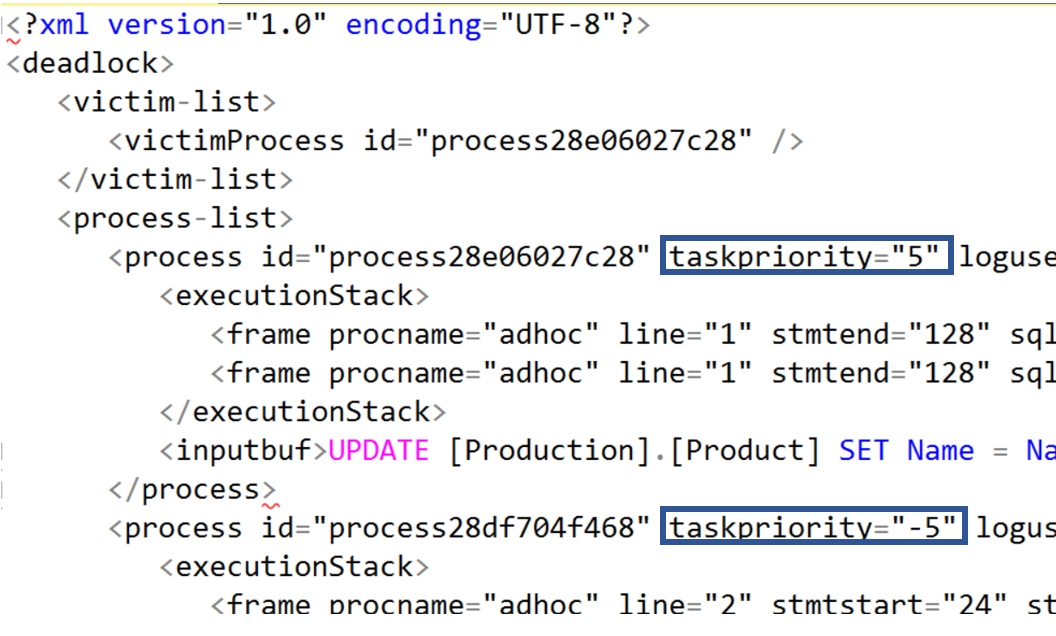
You can also look at the XML to determine the priority of each of the processes.  In the XML you will look for “taskpriority” in the Process-List node.  As you can see below there are two of them, one for the process that succeeded and the victim. The “victimProcess id” identifies the process that was chosen as the victim.

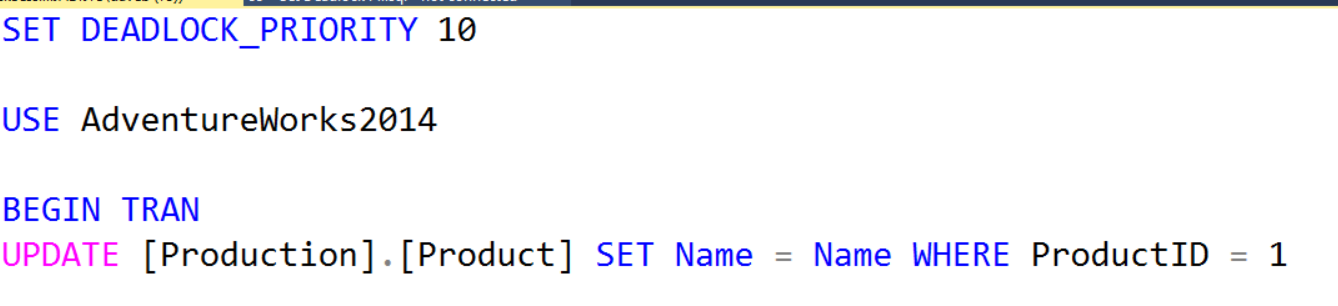
To set the priority for a process, you would add the code below at the beginning for the batch. This setting is for the session.

SET DEADLOCK_PRIORITY 10

This is what the code would look like if using a numeric priority.  Remember, the value must between -10 and 10, inclusive.

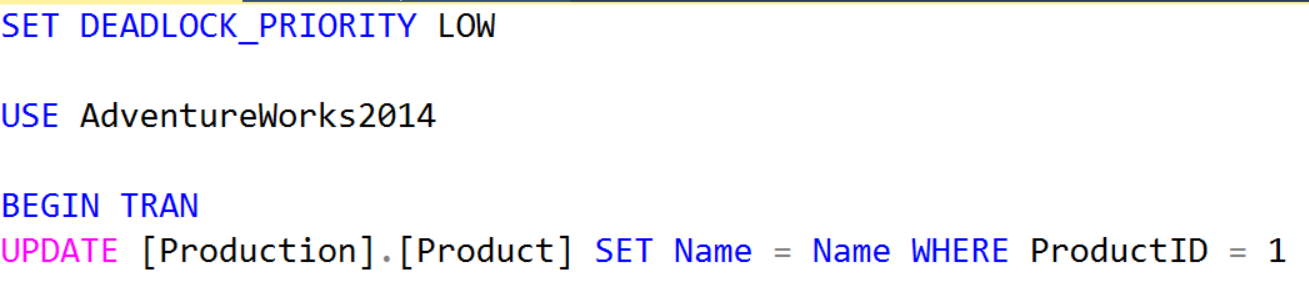
This is what it would look like if you use the LOW, NORMAL, HIGH option.

Thanks for stopping by my blog!!!


Capture Deadlock Information with Extended Events

Over the past few years, I have presented a number of sessions on Extended Events.  As I prepare to present the topic a few more times in the coming weeks, I thought I would do a blog post on one particular event that has been very helpful to me when working with issues in a production environment.  That event is related to the Deadlock graph.

There are several ways you can capture this.  Profiler has been a very good and very effective way of capturing the Deadlock graph. However, starting with SQL Server 2008, there is now another option, Extended Events.  RedGate also puts out a great tool named SQL Monitor that can be used.

I am not going to get into the ins and outs of Extended Events in the post, I am simply going to cover how to use Extended Events to capture the deadlock graph.  There are a total of five events that have the word “deadlock” in the event name.

Let’s take a moment and quickly go over each of these five events.

database_xml_deadlock_report – This will be the same as the xml_deadlock_report, with one noticeable exception.  The xml_deadlock_report event has an additional tab, while the database_xml_deadlock_report does not have this.  This tab is where we will find the graph.

xml_deadlock_report – This is very similar to the database_xml_deadlock_report with the addition of the deadlock graph.  To see the deadlock graph, simply click on the Deadlock tab.

lock_deadlock – “Occurs when an attempt to acquire a lock is canceled for the victim of a deadlock.”  This definition is from the SQL Server Extended Event properties. Of the events we have discussed so far, this event has the most data points.


lock_deadlock_chain – “Occurs when an attempt to acquire a lock generates a deadlock. This event is raised for each participant in the deadlock.” This definition is also from the SQL Server Extended Event properties.

scheduler_monitor_deadlock_ring_buffer_recorded – “The session tracks other useful events which makes it easy to trace back the series of events which led to the deadlocked schedulers condition!” – From www.troubleshootingsql.com

Since this post is about the deadlock graph, we will focus on the xml_deadlock_report event. As mentioned before, this is the event you will need to use if you want to capture the deadlock graph.  There are two points to look at, the column is “XML_report” and the other is the graph itself. In the image below you will see that there are two places to look at the actual XML.  If you do not see this column in the grid, you can right click on it in the details at the bottom and then click “Show column in table”.  It might be very challenging to read due to formatting.  If you are having a difficult time reading the XML, this one of many online formatting tools can be very helpful to get good formatting.

This is the actual XML that is used to build the graph.  This is quite a bit of useful information in the XML.  You can see the victim query as well as many other good data points.  The victim process can be found in the “victim-list” node.  In the image below, you will then see two processes, the first one listed matches the victim process id.  The UPDATE just below it is the T-SQL that was chosen as the victim.


The deadlock graph, while initially looks very useful, it does have a significant limitation.  The query with the blue X on it is the victim.  If you float your cursor above it, the query will then appear in a context pop up.

If you left click and hold one of the shapes you can move it around. This can be useful when there are more shapes than you see above.  Now on to the limitation, you can’t zoom it.  Without this, it can be difficult to see some of the details.

Here are just a few interesting deadlock graphs I have been able to capture.


While these are kind of interesting to look at, the scary part is what caused these.  These were all caused by a single stored procedure.  Now you have the graph.  I think now the fun is just beginning trying to figure out what is causing this and a solution.

If you would like to read more posts about Extended Events, please go to the View All Posts page.

Thank you for stopping by my blog!!!