What is the Data Type Precedence order and how is it used for Implicit Converts?

There are many data types that can be used in SQL Server.  Picking the proper data type is essential, however it is also important to know when SQL Server will automatically complete a type conversion.  When SQL Server automatically converts data types, it will use the Data Type Precedence to determine what will be the target data type for the conversion.

When does SQL Server need to automatically convert data types?  There are a number of places, however you will commonly see this when joining on columns that are not the same data type or in the WHERE clause when comparing two values that are not the same data type.

This image below is a screenshot of the list that was taken from the following Microsoft document, Click Here.

Let’s take a few minutes to go over where data types are used in SQL Server and how to gather information about the data types.  As expected you can use them when creating tables and defining columns.  Each column will have a data type assigned to it.  If you look at the image below you can see the various data types on the Production.Product table in the AdventureWorks2014 sample database.

Another way to get the data types for a particular table is to run one of the following queries.  Of course you will need to change the parameter at the end to the name of the table you are looking for.  Below are two examples. One using an information_schema view, while the other is using the sys.columns table.

SELECT TABLE_CATALOG
, TABLE_SCHEMA
, TABLE_NAME
, ORDINAL_POSITION
, DATA_TYPE
FROM INFORMATION_SCHEMA.COLUMNS
WHERE table_name = ‘salesorderheader’

SELECT name
, Type_name(user_type_id) AS ‘DataType’
, max_length
, precision
, scale, is_nullable
FROM sys.columns
WHERE object_id = OBJECT_ID(‘production.product’)

You will also see data types used with declaring variables and stored procedure parameters.  We declaring a variable, can you not only provide a data type but can also assign the variable a value on the same line.

DECLARE @amount INT = 20

Just an FYI, you can still use the SET keyword to assign the variable a value, as in the code below.

DECLARE @amount INT

SET @amount = 20

Now that the variable is declared and assigned a value, it can now be used.  The type conversions will happen in a few places in the TSQL.  Most commonly it will be seen in the WHERE clause when the datatype in the column is different than the data type of the variable. Using the query below as an example, the variable has been incorrectly declared as a Varchar data type, while the SalesOrderID column is an INT database.  This difference is what is forcing a type conversion when doing the comparison.

DECLARE @SorderID VARCHAR(20)

SET @SorderID = ‘43659’

SELECT *
FROM [Sales].[SalesOrderHeader]
WHERE [SalesOrderID] = @SorderID

How Do I know an Auto Type Conversion took place?  Well there are a couple of different methods.  The first method is to use an Execution Plan. Before running your query, click the button in the red box below.

When looking at an Execution plan you will see a warning sign on the operator if there is an issue.  You can see this below on the operator to the far left, it is a yellow triangle.  This can be a warning for a few things, implicit convert is just one of them.

To find out if this is indeed an implicit convert warning float your mouse over it.  When you do, you will see a popup similar to below.  This clearly shows that a convert took place.

This not only tells you that the convert happened, it also identifies the consequence of the convert.  In this case, if the Cardinality Estimate is affected in a negative manner, the query optimizer may pick a less than ideal plan.  This could lead to a performance problem.

Another approach you can use to find out if an implicit convert happened is to use the sql_variant_property function.  This function accepts two arguments, an expression and a property.  The expression is what you think it might be, this is what we would like to evaluate for the datatype.  While the property has multiple options, we are going to focus solely on using the BaseType property.  We will use this to determine the data type of an expression.  Click here for find more information about the sql_variant_property.

If you look at the code below, you will see that there are two variables being declared and then in turn being passed into the first argument of the sql_variant_property function.  Notice that the two variables are different types, one TinyInt while the other is varchar.

DECLARE @one TINYINT
DECLARE @two VARCHAR(20)

SET @one = 1
SET @two = ‘2’

SELECT SQL_VARIANT_PROPERTY(@one + @two,‘basetype’) AS ‘ResultOfExpression’
, SQL_VARIANT_PROPERTY(@one,’basetype’) AS ‘DataTypeOf @one’
, SQL_VARIANT_PROPERTY(@two,’basetype’) AS ‘DataTypeOf @two’

When you run the above query you will get the results below.  Notice that the second two column return the same data type as the one specified when each of the variables were declared.  As for the first column, I am taking a TINYINT data type and adding it to a varchar datatype.  Because the data types are different, SQL Server will automatically convert the result to the variable data types that are higher up the precedent level.  In this case the resulting value will be a TINYINT.  SQL Server converted the ‘2’ to an tinyint data type from a varchar data type.

One additional tool you can use to capture implicit converts is Extended Events.  If are not familiar with Extended Events this is just a bit outside the level of this post.  However, I will cover a few basics.  Extended Events is a tool that can be used to capture information about what is happening on your server. Here is a link of a session I did at the SQL Saturday event in Dallas in 2018.  This will give you a high level overview of how to create a session.  Click Here.  Also, Grant Fritchey has a number of great blog posts on Extended Events.  They can be found here.

If you are familiar with Extended Events, the event you will want to use is the plan_affecting_convert event.

Here is the description of this event:

“Occurs when a type convert issue affects the plan. The expression value indicates the conversion that can cause inaccurate Cardinality Estimation or prevent from using a seek based plan in the query plan choice. If performance is affected, rewriting the query could help.”

Below is an example of what the data will look like.  We are able to collect the time as well as the query.  While these additional items are not in the below image, you can also collect the host, database name and login name.

Now that we have covered what implicit converts are, you might be wondering how can I prevent the auto conversions?  This is more of an matter of design than anything else.  Below are a few suggestions that will help prevent type conversions.

      • Declare data types appropriately for variables when writing TSQL code
      • User proper data types when designing parameters for stored procedures
      • Chose proper data types for table columns

In summary, there are a number of tools that we can use to identify when implicit converts.  Once you know when they are happening you can now begin to assess if it is causing a performance issue or not.  If so, you can begin to work on a solution.

Thanks for visiting my blog!!!

How to capture an Execution Plan

Since in the coming weeks I will be presenting a session on Execution plans at a few SQL Saturday events, I thought I would do a post on how to capture execution plans.  Execution plans are a critical tool when attempting to troubleshoot a performance issue.  SQL Server Management Studio is one of the common tools we use to get the plan, if we have the query. You can also use Extended Events and Query Store.

Using SSMS

In SSMS there are two options to capture the execution plan, Actual and Estimated plan. The biggest difference between the two is that the Actual plan needs to execute the query, while the estimated plan uses statistics to create the plan and does not execute the query.

To get the Estimated Execution plan, you can use the Query menu. There you will find the Display Estimated Execution Plan menu item.

There a two ways to get the actual execution plan.  One is on the tool bar and the other is on the Query menu.

When looking to capture the estimated execution plan, as soon as you click on the menu item, the plan will be returned.  If you are looking for the actual execution plan, SQL Server will execute the query and when it is finished the plan will be returned.  For simple queries the estimated execution plan will be returned very fast, however for more complex queries it might take some time.

When in SSMS, how can I tell if the plan is actual or estimated? There are a few ways. The easiest way is to check the number of tabs.  As you can see below there are two tabs, one for messages and another for Execution Plan.  There is a missing table, results.

Estimated Execution Plan:  Two tabs

Actual Execution Plan: Three tabs

Another way to determine if the plan is actual or estimated will require us to dig a little deeper.  We will need to look at the properties of a few of the operators.

When you float the cursor over the Index Scan you will see this popup.  The items in the green boxes are for the actual execution while the items in the red boxes is for estimated execution.  Although having the options for estimated execution, you might think this is for the estimated execution, it is not.

When both estimated and actual number of rows can be found in the pop up, this means that it is an actual execution plan.  If it were an estimated execution plan, you will not see the actual items, as you can see in the image below.

If the estimated and actual plans are captured very close to each other, you will not see much difference.  However, if there are a large period of time between them, there could be a number of differences.

This will work with both an on-prem instance of SQL Server as well as an Azure SQL Database.

Extended Events

Using SSMS works great if we have the query, however it is a manual process.  What if you want to capture the plans after hours or automatically.  This is where Extended Events comes into play.  Just a word of warning, when capturing execution plans with Extended Events, you could actually cause a performance problem so be careful.

This is what Microsoft has placed in the description of the events related to Execution Plans. I think it is a pretty clear warning about using Extended Events to capture Execution plans.

“Using this event can have a significant performance overhead so it should only be used when troubleshooting or monitoring specific problems for brief periods of time.”

When working with an On-Prem instance of SQL Server, Extended Events can be found under “Management”.  This is a server level setting, although you can limit the activity captured to a single database.

The location is slightly different for an Azure SQL Database.  Extended Events can be found under the database.

You can right click on the “Sessions” folder under Extended Events and then click “New Session”.

When creating the session there are three events we will want to consider. These events can be found in both an on-prem instance as well as Azure SQL Database.

query_pre_execution_showplan – this event is the equivalent of an estimated execution plan

query_post_execution_showplan – this event can be used to capture the actual Execution plan.

query_post_compilation_showplan – Occurs after a SQL statement is compiled.

To create an Extended Event session you can either use SQL Server Management Studio by right clicking “Session” under the  Extended Events item or using the CREATE SESSION statement.

If using SSMS graphical tool, you can right click on Sessions and then click “New Session” you will see something similar to this.

Once you give the session a name, the you are ready to move on to picking the proper events.  Remember, there are three options for events, query_pre_execution_showplan and query_post_execution_showplan.

If you enter “showplan” into the Event Library search box.  You will see four events, the three mentioned earlier and a fourth related to Query Store.  We will discuss this one later.

Move the events over by clicking the “>” button and then you are ready to add the target.  Once you do, save the session, start it and you will now be collecting execution plans.

You can also use the CREATE EVENT SESSION statement. The statement below collects all three events, again NOT recommended.  Notice that this statement also has a filter for the AdventureWorks2014 database.  If you do decide to attempt, what even Microsoft says you should use with caution, try to reduce activity by limiting the collection to a single database.

CREATE EVENT SESSION [ExecutionPlan] ON SERVER
ADD EVENT sqlserver.query_post_compilation_showplan,
ADD EVENT sqlserver.query_post_execution_showplan,
ADD EVENT sqlserver.query_pre_execution_showplan(SET collect_database_name=(1)
    ACTION(sqlserver.sql_text)
    WHERE ([database_name]=N’AdventureWorks2014′))
ADD TARGET package0.event_file(SET filename=N’ExecutionPlan’),
ADD TARGET package0.ring_buffer
WITH (MAX_MEMORY=4096 KB,EVENT_RETENTION_MODE=ALLOW_SINGLE_EVENT_LOSS,MAX_DISPATCH_LATENCY=30 SECONDS,MAX_EVENT_SIZE=0 KB,MEMORY_PARTITION_MODE=NONE,TRACK_CAUSALITY=OFF,STARTUP_STATE=ON)
GO

Now that we are collecting the plans all we have to do is right click on the target and then click view data.  You will see something similar to below.  Notice the Query Plan tab highlighted.

If you right click on the plan you will see this context menu.  You can now save the plan, view the XML and even open the SentryOne Plan Explorer, if you have it installed.  If you don’t have it installed…..go get it.  It is a great tool.


Extended Events are a great tool to collect information about what is going on in your server.  As stated several times, if you are looking to Extended Events to collect your execution plans, do so very cautiously.  Also, limit the time the sessions is running and limit the activity to only the database you are looking to find a solution to a performance problem.

Query Store

The last option we will cover is Query Store.  This is a great tool!!!  Query Store came out with SQL Server 2016.  What I like about Query Store is that it allows me to collected the needed execution plans without the overhead of Extended Events.

To enable Query Store, simply go to the properties of the database and select Query Store.  The Operation Mode Property is Off by default. Change this to either Read or Read Write.  Now Query Store is enabled.

Notice that there are two Operation Mode properties.  One is actual and the other is Requested.  If you change Requested to something different than Actual, once you click OK, the requested setting will now become the actual setting.

Per Microsoft, here are a number of scenarios of why you might want to utilize Query Store.

Once you enable it and are collecting data, there are a number of reports that you can use to view the plans. Under that database, in this case, AdventureWorks2014, you will now see an option for Query Store.  When you expand it, you will see the reports that are available to you.

When you right click on one of the reports you will see something similar to this. By clicking on the bar in the chart on the upper left, the other two panels will update.  As you can see, the execution plan is in the bottom panel.

Once you have the plan visible, it works just like all the option methods of collecting the plan.  You can view the properties of each operator as well as save the plan for analysis later.

If you utilize query store, there is an event in Extended Events you might want to consider.  This event is query_store_generate_showplan_failure and will fire when the Query Store has an error creating the plan.

Here is the description from the event:

“Fired when Query Store failed to store a query plan because the showplan generation failed”

This post is about how to collect the Execution Plans, including Query Store.  In this post, I am not going to get indepth about all the options of Query Store.  There is some really great information out there, including some great videos.  Eric Stellato has some great content on Query Store in a number of locations, including SQLSkills.com, SQLPerformance.com and yes, even YouTube.

Query Store on SQLPerformance

There are number of options of collecting Execution plans.  My preference would be to utilize Query Store. Mostly because it captures the plans automatically, has really good reporting and has very low overhead.

Thanks for visiting my blog!!!

Extended Events – Reading Multiple Session Files

Extended Events are a very useful tool when trying to troubleshoot performance issues. When setting up an Extended Event session there are multiple options for the storage of the data.  One of the most common targets for storage is the event_file target.  This type of storage can be used for both an on-prem instance of SQL Server as well as an Azure SQL database.

This post will go over how to read from both locations, on-prem and an Azure storage account.  They are similar, but different enough to cover here. The biggest difference as you will see, is setting everything up properly so you will be able to read multiple files with one TSQL statement.

When setting up a event_file there are a few options that can be set.  Of course the most logical is the path to the location where the files will be placed.  You will also have the opportunity to set the size of the files, maximum number of files as well as whether or not to allow file roll over.

Since you might have more than one file,  you may want to read from multiple files with the same query, that is the focus of this blog post.  Of course in order to read from a file, the file name is important, even if reading from multiple files.  If you look at the image below, you will see that there is a large number attached to the end of the file name.  Just a side note, I like to name the file the same as the Extended Event session name.  This makes it easier to match the files to the session.

According to Microsoft the number at the end of the file name is calculated using the following method:

“The integer value is calculated as the number of milliseconds between January 1, 1601 and the date and time the file is created.”

Reading On-Prem Files

When reading from a event_file target, the fn_xe_file_target_read_file function is used.  The first parameter of this function is the file path, which includes the file name.

Using the two files in the above image as an example, if I want to read from a single file, I would include the full path including the name of the file.

SELECT event_data = CONVERT(xml, event_data)
INTO #eeTable
FROM sys.fn_xe_file_target_read_file(N’C:\temp\ExecutionTImeOut_0_131920765279670000.xel’, null, null, null);

Notice that in order to read from the file, I included the full name of the file.  However, there are two files due to the rollover.  What do I need to do to read from both files in one query?

In order to do this, there is one simple change that needs to be made.  Notice in the code below, the file name has been modified to use the “*” following the name.  The number at the end of the file is no longer needed.

SELECT event_data = CONVERT(xml, event_data)
INTO #eeTable
FROM sys.fn_xe_file_target_read_file(N’C:\temp\ExecutionTImeOut*.xel’, null, null, null);

This will now return the data from all the XEL files in the location specified that start with “ExecutionTimeOut”.

Reading from Azure Storage Account

This works great for an on-prem instance of SQL Server, however there are some changes that must be made when quering the file targets of an Azure SQL database.

Before we get into the change that needs to be made, let’s go over a few prerequisites on using Extended Events for an Azure SQL Database and using an Azure storage account.  This blog will not get very deep into a few of the prerequisites, however they do need to be mentioned.

The first prerequisites is having an Azure Storage account.  When you do this, you will given a few options for the type of storage.  This can be obtained in your Azure portal.  You will need to decide on a few things as well, including what subscription you will use for the storage account and what region it is in.

To create the storage account, simply click the “Storage Account” menu item in the Azure portal.  You will need to fill in all the requested information.

Now that you have provided all the requested information, you can now utilize the storage.  When picking a target type in the Extended Events “wizard”, my preference is the event_file target type.

In order to read the Extended Event files, you will also need to get the EndPoint for the storage account.  As you can see above, you will need to go to the properties of the storage account.  When you do you will then have to capture the Endpoint for the type of storage account you chose.  In this case, the option would be between a file storage account or a Blob storage. Notice that the two Endpoints only have one small difference, right before the word “core”, you will see either File or Blog.  You just need to copy the path to the clip board.  You will need this path when reading the Extended Event files.

The next item you will need is a Shared Access Signature for the storage account. This can be obtained a few different ways.  One is to use the Azure Storage Explorer and the other is to use the Azure portal.

To obtain this signature using the Azure portal navigate to the storage account and then click “Shared account Signature”.  The screen on the right will then be populated with the settings of the signature.  One important setting you want to be aware of is the End option under “Start and Expiry data\time” section.  Make sure you pick the appropriate duration. When this data\time has past you will no longer be able to read the files in the storage account. When you tried to read an Extended Event file and the End date has past, you will not receive an error, you will just see no records returned.

Towards the bottom of the above screen, after you scroll down a bit, you will see a button that looks like the blue button at the top of image below.  When you click that, the SAS token will appear.  This is what we will need to read the Extended Event files.  To capture this, just click the blue button to the right of the box under SAS token.  In the blue box below, you will see two date, these are the start and end date for the token.  When the end date has past the token will no longer work and your queries to read from the files will not return any data.  In addition, you will also not get an error.

We are almost done with the prerequisites. Once you have configured the Extended Event session to use a Storage Account and the session is running, you a ready to read the files.  There is a lot of really good information out there on how to create an Extended Event session..

The last requirement is to create a database scoped credential in your Azure SQL Database.  To do this, you will need to SAS token mentioned about.  However, notice that there is a “?” at the front of it.  This “?” you will need to remove prior to creating the credential.

Although not a requirement, I would also highly recommend that you download the Azure Storage Explorer.  It is a very nice tool that can make our lives much easier when working with storage accounts.

To create the credential, you will use SQL Server Management Studio.  Below you will see the code used to create the credential.  First thing to remember is that you must run this code when connected to your Azure SQL Database.  Notice the path right after the CREATE line.  This is the path to your storage account and must start with HTTPS.  When you read this code, you will find the “SECRET”, this is where you place the SAS token you captured earlier.  Please remember to take the “?” out before executing the code.

CREATE DATABASE SCOPED CREDENTIAL [https://MyStorageAccountName.blob.core.windows.net/eefiles]
  — this name must match the container path, start with https and must not contain a forward slash at the end, in this case, the container is eefiles
WITH IDENTITY=‘SHARED ACCESS SIGNATURE’
  — this is a mandatory string and should not be changed  
 , SECRET = ‘sv=2018-03-28&ss=bfqt&srt=sco&sp=rwdlacup&se=2019-07-01T09:53:56Z&st=2019-07-01T01:53:56Z&spr=tldodr43465kadfuJRsCYUmi1OmYywUjw%3D’
   — this is the shared access signature key that you obtained from the portal, this shared access signature has been changes for security reasons
GO

You can run this code querying the  sys.database_credentials view to confirm the credential was actually created.  Make sure to be connected to your Azure SQL Database.

SELECT * FROM sys.database_credentials

Finally we have all the prerequisites done, now we can move on to actually reading the files.

As you can see in the image below, the file names follow the same pattern as an on-prem instance of SQL Server.

Now that we are ready to read the files, one change you will need to make is put the path to your storage account.  The code below will read just from the file hard coded in the path.

SELECT event_data = CONVERT(xml, event_data)
INTO #eeTable
FROM sys.fn_xe_file_target_read_file(
    ‘https://MyStorageAccountName.blob.core.windows.net/eefiles/efiles_0_132044728780700000.xel’,
                null, null, null
            );;

However, we need to read from all the files.  When reading multiple files with an on-prem instance of SQL Server, we simply removed the number at the end of the file name and replaced it will an “*”.  Logic would say that should work when reading from an Azure Storage account, but it doesn’t work.  You will not get an error either. It will just not return any rows.

This will work, but will not generate an error either, just no rows.

‘https://MyStorageAccountName.blob.core.windows.net/eefiles/efiles*.xel’,

The only change we need to make to the above code, is remove the numbers at the end of the file.  Make sure to include the front part of the name and remove the file extension as well.

‘https://MyStorageAccountName.blob.core.windows.net/eefiles/efiles’,

Now, you can read from all the files with one query.  However, you need to make sure you are not pulling too much data, it could time out.  As it has for me a few times.

Using SSMS Menu items

Another way to read from multiple target files is inside SSMS.  However, it only works for an on-prem instance of SQL Server.  On the File menu, Open you will then see a pop out menu with “Merge Extended Event Files…” item.

When you click, you will have the option to navigate to the location of the files you wish to merge and display the data.  You will see the form like the one below.

You will then click the Add button and select the desired files.  You can use Control+ click to select more than one file.  Once you do, the files will be listed and you just click OK for the data to be displayed in SSMS.  Remember, this does not work for an Azure SQL Database.

The files don’t have to be from the same session to merge them, although many times they will be.  As you can see below there are files from two different sessions, the deadlock session and the ExecutionTimeout session.

Once the data is merged and displayed in SSMS, you can group the data by event. This can be done by right clicking on the column in the top half of the results and going to “Group by this column”.  The results will then look similar to the image below.  Notice that the top four rows are from the Deadlock session, while the bottom row, the Attention event, is from the QueryTimeout session.


Additional Code to Read the XML Data

While this post is about how to read mulitple files, I also want to include the code to parse through the resulting XML from the above code.  If you look, the above code simply takes the data and converts it to XML.  While the code below will parse the XML into a more readable format. You will need to make a few changes.  You will need to use your path to your storage account and you will need to update the columns you want to extract from the XML.

If you look at the code below, there are three steps.  Well actually only two, the middle step is optional.

–Extract the XML

SELECT event_data = convert(xml, event_data)
INTO #eeTable
 FROM sys.fn_xe_file_target_read_file(
                — Fill in Storage Account name, and the associated Container name.
                ‘https://Mystorageaccount.blob.core.windows.net/eefiles/efiles’,
                null, null, null
            );;
–SELECT statement just to confirm there are rows, this is not needed
SELECT * FROM #eeTable
–Parse the XML and put it into the temporary table
SELECT
  ts  = event_data.value(N'(event/@timestamp)[1]’, N’datetime’),
  [sql]  = event_data.value(N'(event/action[@name=”sql_text”]/value)[1]’, N’nvarchar(max)’),
  duration  = event_data.value(N'(event/data[@name=”duration”]/value)[1]’, N’nvarchar(max)’),
  spid  = event_data.value(N'(event/action[@name=”session_id”]/value)[1]’, N’int’),
  user_nm = event_data.value(N'(event/action[@name=”username”]/value)[1]’, N’nvarchar(max)’),
  dbname = event_data.value(N'(event/action[@name=”database_name”]/value)[1]’, N’nvarchar(max)’),
  explan  = event_data.value(N'(event/data[@name=”showplan_xml”]/value)[1]’, N’nvarchar(max)’)
FROM #eeTable
ORDER BY ts
DROP TABLE #eeTable


You can get the column names from the Extended Events GUI.  When you are looking at the Action tab, you would use ‘event\action’.  When you want to pull a column in the “event fields” table.  Something to remember, if you misspell a column name, you will not get an error when you run the query.  The column will just be NULL for every row.

Here is an example of where to get the Action column names. Notice that they can be found on the Global Fields(Actions) table.

Below is an example of the “Data” fields.  Notice that the “Event Fields” tab is that active tab.

Now you can read from multiple Extended Event files with a single statement.  This will allow you to take the results, dump the data into a temporary table and then use T-SQL to find the data you are looking for.

Thank you for visiting my blog!!!!

Extended Events File Target – File Rollover and Max File Size settings

Extended Events has a number of options for the storage of the events.  These include Ring_buffer, pair_matching, event_file and several others.  As expected, each of these have different options for configuration.  This post is about the event_file target.  As a side note, Extended Event sessions will have only one target, it is possible to have more than one.  The System_Health session does have two, event_file and ring_buffer.

Below you will find a screenshot of the options for the event_file target.  These are the same type of options we have had in Profiler for many years.

File name just identifies what the file name will start with.  As you can see in the image below, SQL Server adds a large number to the file name.  This number represents the number as defined below.

“The integer value is calculated as the number of milliseconds between January 1, 1601 and the date and time the file is created.”

The other options are pretty straight forward. The Maximum file size has two option, MB and GB.

If I only have a few sessions, I could easily go and look at each session.  However, what if I have a large number of sessions and I want to review these settings for all sessions.  It would be nice to be able to pull this information out of the database using T-SQL.

When using Extended Events, there are a number of DMVs that can help us gather information about the sessions that exist on the server. If you do a Google search on “DMV Extended Events” you will get a number of links that point to one of the views in the list below.  Notice that they all start with “dm_ex_”.  These are very useful views, however the data we are looking for can not be found in any of these.

To get this information we need to look in a different set of views.  These views start with “server_event” for an on-prem instance and “database_event” for an Azure SQL database.  Below is a list of this set of views.

To get the information we are looking for we need to use two of these, server_event_session_fields and server_event_sessions.  We will need to join these two views on the event_session_id column in both views.  If you look at the image below, you will notice that SQL Server stores the values as a row in the view rather than a column for each option.  Even though the GUI offers us two options for the maximum file size, MB and GB, the actual value is stored in MB.

For the maximum file size and the maximum rollover files, you will not see them in these views unless they are changed from the default. If you look at the image below there is one of the options missing, maximum rollover files.  This is because it is set to the default value of 5.

Just a little note about the max_rollover_files option.  This has a default of 5, as stated earlier, however if you see that it has a value of 0, then the “Enable File Rollover” is set to false.  As in the image below.  If you are wondering why all the options are not active, this is because the target has already been created.

To get the defaults we need to run the query below.

SELECT    name
  , object_name
  , type_name
  , column_value
  , description
FROM sys.dm_xe_object_columns
WHERE object_name = ‘event_file’

When you run the above query, your result set will look like what is below.  Notice the Max File Size and Max Number of files.

To get the data we are looking for we need to use the query below.

SELECT
 s.name,
 f.name,
 f.value
FROM 
 sys.server_event_session_fields AS f
INNER JOIN
 sys.server_event_sessions AS s
ON
 f.event_session_id = s.event_session_id
WHERE f.name IN (‘filename’ ,‘max_file_size’,‘max_rollover_files’
  , ‘filename’)
ORDER BY s.name

I have taken above code and used the PIVOT to hopefully make the results more readable.  This code also takes into account the default values, that as you may remember is in a different location.


Here is the complete code for an on-prem instance of SQL Server, including the PIVOT.

DECLARE @cols      AS NVARCHAR(MAX)
DECLARE @query  AS NVARCHAR(MAX);
CREATE TABLE #EEOptions
  ( OptionName  sql_variant,
    Filename   sql_variant,
    MaxFileSize  sql_variant,
    MaxRolloverFiles sql_variant)
 
SET @cols = STUFF((SELECT DISTINCT ‘,’ + QUOTENAME
       name)
      FROM  sys.server_event_session_fields
      WHERE name IN (‘filename’ ,‘max_file_size’,‘max_rollover_files’
        , ‘filename’)
            FOR XML PATH(), TYPE
            ).value(‘.’, ‘NVARCHAR(MAX)’)
        ,1,1,)

 
SET @query = ‘Insert #EEoptions SELECT SessionName AS ”OptionName”, ‘ + @cols + ‘ from
            (
            SELECT
 s.name AS ”SessionName”,
 f.name as ”OptionName2”,
 f.value
FROM 
 sys.server_event_session_fields AS f
INNER JOIN
 sys.server_event_sessions AS s
ON
 f.event_session_id= s.event_session_id
WHERE f.name IN (”filename” ,”max_file_size”,”max_rollover_files”
  , ”filename”)

           ) x
            pivot
            (
                  Max(value)
FOR OptionName2 IN  (‘ + @cols + ‘)
            ) p ‘
 
 
EXECUTE(@query)
SELECT OptionName
  , Filename
  , ISNULL(MaxFileSize, 1024) AS ‘MaxFileSize’
  , ISNULL(MaxRolloverFiles, 5) AS ‘MaxRolloverFiles’
FROM #EEOptions
DROP TABLE #EEOptions
This code will not work for an Azure SQL Database.  I will hopefully complete a post on how to do this in Azure.  One thing I can mention is that the properties are slightly different. Notice that the Maximum files size still an option, however Maximum Rollover files is not.
Thanks for taking the time to read my blog.  It is always appreciated.

Extended Events – Database Restore

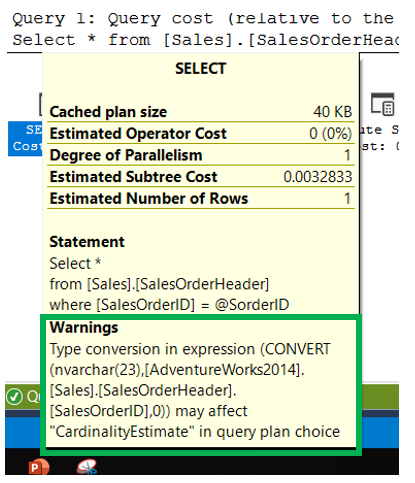
Many of us have restored productions databases.  Of course no one wants to do it, but we all acknowledge that there are times in which that is exactly what we need to do, restore a database.  Have you ever wondered what steps SQL Server actually goes through to complete the restore?  Extended Events offers an event that will allow us to see inside the restore process.

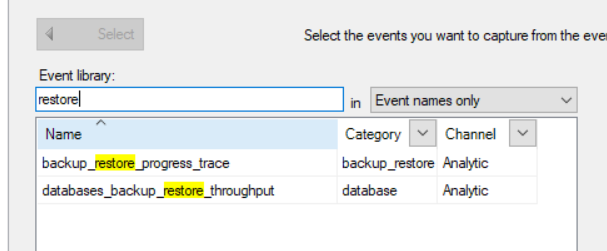
When I did a search of what events are available for restore operations, I found two, backup_restore_progress_trace and databases_backup_restore_throughput. Backup_restore_progress_trace will be the focus of this post.

Backup_restore_progress_trace does exactly what you might think it would do, documents the internal steps of the restore process.

Below are all the steps that Backup_restore_progress_trace picked up during a restore of a very small database.  These are also in the order in which the steps took place.  These steps are for a restore to a database that does not exist yet.

RESTORE DATABASE started
Opening the backup set
Processing the leading metadata
Planning begins
Effective options: Checksum=0, Compression=0, Encryption=0, BufferCount=6, MaxTransferSize=64 KB
Planning is complete
Beginning OFFLINE restore
Attached database as DB_ID=5
Preparing containers
Containers are ready
Restoring the backup set
Estimated total size to transfer = 2838528 bytes
Transferring data
FileHandleCache: Initial CacheSize: 48
BackupStream(0): Processing MSDA of size 43 extents
6 percent (196608/2838528 bytes) processed
11 percent (327680/2838528 bytes) processed
16 percent (458752/2838528 bytes) processed
20 percent (589824/2838528 bytes) processed
25 percent (720896/2838528 bytes) processed
30 percent (851968/2838528 bytes) processed
36 percent (1048576/2838528 bytes) processed
41 percent (1179648/2838528 bytes) processed
46 percent (1310720/2838528 bytes) processed
50 percent (1441792/2838528 bytes) processed
55 percent (1572864/2838528 bytes) processed
60 percent (1703936/2838528 bytes) processed
66 percent (1900544/2838528 bytes) processed
71 percent (2031616/2838528 bytes) processed
76 percent (2162688/2838528 bytes) processed
80 percent (2293760/2838528 bytes) processed
85 percent (2424832/2838528 bytes) processed
90 percent (2555904/2838528 bytes) processed
96 percent (2752512/2838528 bytes) processed
BackupStream(0): Completed MSDA
Waiting for log zeroing to complete
Log zeroing is complete
BackupStream(0): Processing MSTL (FID=2, VLFID=36, size=65536 bytes)
100 percent (2838528/2838528 bytes) processed
Data transfer is complete
Backup set is restored
Offline roll-forward begins
Processing 8 VLF headers
Processing VLF headers is complete
First LSN: 36:4232:37, Last LSN: 36:4272:1
Stop LSN: 36:4272:1
Offline roll-forward is complete
Database fixup is complete
Transitioning database to ONLINE
Restarting database for ONLINE
PostRestoreContainerFixups begins
PostRestoreContainerFixups is complete
PostRestoreReplicationFixup begins
PostRestoreReplicationFixup is complete
Database is restarted
Resuming any halted Fulltext crawls
Writing history records
Writing history records is complete (elapsed = 58 ms)
MSDB maintenance is complete
RESTORE DATABASE finished

Many these steps are pretty straight forward.  They can also easily group the steps into phases.

The first few steps are simply to prepare for the restore.  Once SQL Server is done preparing, it then starts the restore.  You can see there are a number of steps in this process, including the assigning of a database ID.  Then you can see the increments in percent of where the restore stands.  Once the restore is complete, SQL Server moves on to the steps in which SQL Server a rolls forward transactions, brings the database online and starts the database.  After this, SQL Server the writes the history into the MSDB system tables.

While these steps are for a new database, many of the same steps will take place for the restore of an existing database.  The most noticeable additions to the steps are the acquiring of database locks.  As you can see below, these are Exclusive locks.

Acquiring X lock on the database

Acquired X lock on the database

SQL Server will spend varied amounts of time on each step.  As expected, the most time is spent on the actual transfer of data to the restored database. Below you will see a table with two columns, timestamp for each and the step name for the restored I completed for this test.  While this process only took a few seconds, a larger database would obviously take much more time.

Time Stamp At Start of Step Operation
00:11:38.457 RESTORE DATABASE started
00:11:38.457 Opening the backup set
00:11:38.473 Processing the leading metadata
00:11:38.473 Planning begins
00:11:38.490 Effective options: Checksum=0,

Compression=0, Encryption=0, BufferCount=6, MaxTransferSize=64 KB

00:11:38.490 Planning is complete
00:11:38.490 Beginning OFFLINE restore
00:11:38.490 Attached database as DB_ID=5
00:11:38.490 Preparing containers
00:11:38.577 Containers are ready
00:11:38.640 Restoring the backup set
00:11:38.640 Estimated total size

to transfer = 2838528 bytes

00:11:38.640 Transferring data
00:11:38.640 FileHandleCache: Initial CacheSize: 48
00:11:38.640 BackupStream(0): Processing

MSDA of size 43 extents

00:11:38.653 6 percent (196608/2838528 bytes) processed
00:11:38.657 11 percent (327680/2838528 bytes) processed
00:11:38.660 16 percent (458752/2838528 bytes) processed
00:11:38.667 20 percent (589824/2838528 bytes) processed
00:11:38.687 25 percent (720896/2838528 bytes) processed
00:11:38.687 30 percent (851968/2838528 bytes) processed
00:11:38.700 36 percent (1048576/2838528 bytes) processed
00:11:38.713 41 percent (1179648/2838528 bytes) processed
00:11:38.713 46 percent (1310720/2838528 bytes) processed
00:11:38.713 50 percent (1441792/2838528 bytes) processed
00:11:38.740 55 percent (1572864/2838528 bytes) processed
00:11:38.740 60 percent (1703936/2838528 bytes) processed
00:11:38.763 66 percent (1900544/2838528 bytes) processed
00:11:38.763 71 percent (2031616/2838528 bytes) processed
00:11:38.763 76 percent (2162688/2838528 bytes) processed
00:11:38.790 80 percent (2293760/2838528 bytes) processed
00:11:38.790 85 percent (2424832/2838528 bytes) processed
00:11:38.797 90 percent (2555904/2838528 bytes) processed
00:11:38.817 96 percent (2752512/2838528 bytes) processed
00:11:38.837 BackupStream(0): Completed MSDA
00:11:38.840 Waiting for log zeroing to complete
00:11:38.877 Log zeroing is complete
00:11:38.877 BackupStream(0): Processing MSTL (FID=2, VLFID=36, size=65536 bytes)
00:11:38.880 100 percent (2838528/2838528 bytes) processed
00:11:38.897 Data transfer is complete
00:11:38.910 Backup set is restored
00:11:38.957 Offline roll-forward begins
00:11:38.957 Processing 8 VLF headers
00:11:38.960 Processing VLF headers is complete
00:11:38.963 First LSN: 36:4232:37, Last LSN: 36:4272:1
00:11:38.963 Stop LSN: 36:4272:1
00:11:38.967 Offline roll-forward is complete
00:11:38.990 Database fixup is complete
00:11:38.993 Transitioning database to ONLINE
00:11:38.993 Restarting database for ONLINE
00:11:39.093 PostRestoreContainerFixups begins
00:11:39.097 PostRestoreContainerFixups is complete
00:11:39.100 PostRestoreReplicationFixup begins
00:11:39.267 PostRestoreReplicationFixup is complete
00:11:39.277 Database is restarted
00:11:39.297 Resuming any halted Fulltext crawls
00:11:39.307 Writing history records
00:11:39.367 Writing history records

is complete (elapsed = 58 ms)

00:11:39.367 MSDB maintenance is complete
00:11:39.370 RESTORE DATABASE finished

Hidden within the steps are some very useful tidbits of information.

    • Database ID
    • Number of Extents
    • Number of bytes restored
    • Beginning and Ending LSN for the roll forward
    • Total time to write history records

While the very small test database took about 60 steps to complete, I was wondering what if the database was bigger.  Using the AdventureWork2014 database, I completed a restore and there were many more steps, a total of 114 steps.  Below are the steps in order.

backup_restore_progress_trace 2019-06-18 11:17:01.5974587 +00:00 BACKUP LOG started

backup_restore_progress_trace 2019-06-18 11:17:01.5975148 +00:00 Acquiring U lock on the database

backup_restore_progress_trace 2019-06-18 11:17:01.5975471 +00:00 Synchronizing with other operations on the database is complete

backup_restore_progress_trace 2019-06-18 11:17:01.5988528 +00:00 Halting Fulltext crawls

backup_restore_progress_trace 2019-06-18 11:17:01.5994759 +00:00 Acquiring X lock on the database

backup_restore_progress_trace 2019-06-18 11:17:01.5995329 +00:00 Acquired X lock on the database

backup_restore_progress_trace 2019-06-18 11:17:01.6135276 +00:00 Writing a failover checkpoint

backup_restore_progress_trace 2019-06-18 11:17:01.6753875 +00:00 Failover checkpoint is complete

backup_restore_progress_trace 2019-06-18 11:17:01.6755993 +00:00 Failover FlushCache is complete

backup_restore_progress_trace 2019-06-18 11:17:01.6756137 +00:00 Opening the backup media set

backup_restore_progress_trace 2019-06-18 11:17:01.6801075 +00:00 The backup media set is open

backup_restore_progress_trace 2019-06-18 11:17:01.6801651 +00:00 Preparing the media set for writing

backup_restore_progress_trace 2019-06-18 11:17:01.6811968 +00:00 The media set is ready for backup

backup_restore_progress_trace 2019-06-18 11:17:01.6812025 +00:00 Effective options: Checksum=0, Compression=0, Encryption=0, BufferCount=7, MaxTransferSize=1024 KB

backup_restore_progress_trace 2019-06-18 11:17:01.6812297 +00:00 Start LSN: 500:27608:118, SERepl LSN: 0:0:0

backup_restore_progress_trace 2019-06-18 11:17:01.6812385 +00:00 First LSN: 630:28048:1

backup_restore_progress_trace 2019-06-18 11:17:01.6812477 +00:00 Estimated total size = 542920704 bytes (data size = 0 bytes, log size = 542920704 bytes)

backup_restore_progress_trace 2019-06-18 11:17:01.6812508 +00:00 Work estimation is complete

backup_restore_progress_trace 2019-06-18 11:17:01.6812559 +00:00 Last LSN: 663:7624:1

backup_restore_progress_trace 2019-06-18 11:17:01.6812606 +00:00 Scanning filestream data

backup_restore_progress_trace 2019-06-18 11:17:01.6819216 +00:00 Scanning filestream data is complete

backup_restore_progress_trace 2019-06-18 11:17:01.6819294 +00:00 Writing the leading metadata

backup_restore_progress_trace 2019-06-18 11:17:01.6819931 +00:00 BackupStream(0): Writing leading metadata to the device C:\Program Files\Microsoft SQL Server\MSSQL14.MSSQLSERVER\MSSQL\Backup\AdventureWorks2014_LogBackup_2019-06-18_06-16-59.bak

backup_restore_progress_trace 2019-06-18 11:17:01.6821581 +00:00 Copying filestream data

backup_restore_progress_trace 2019-06-18 11:17:01.6905789 +00:00 Copying filestream data is complete

backup_restore_progress_trace 2019-06-18 11:17:01.6905984 +00:00 Copying transaction log

backup_restore_progress_trace 2019-06-18 11:17:01.6907865 +00:00 MediaFamily(0): FID=2, VLFID=630, DataStreamSize=2424832 bytes

backup_restore_progress_trace 2019-06-18 11:17:01.7037592 +00:00 MediaFamily(0): FID=2, VLFID=631, DataStreamSize=16777216 bytes

backup_restore_progress_trace 2019-06-18 11:17:01.7704909 +00:00 MediaFamily(0): FID=2, VLFID=632, DataStreamSize=16777216 bytes

backup_restore_progress_trace 2019-06-18 11:17:01.8050246 +00:00 5 percent (27590656/542920704 bytes) processed

backup_restore_progress_trace 2019-06-18 11:17:01.8396719 +00:00 MediaFamily(0): FID=2, VLFID=633, DataStreamSize=16777216 bytes

backup_restore_progress_trace 2019-06-18 11:17:01.9147575 +00:00 MediaFamily(0): FID=2, VLFID=634, DataStreamSize=16777216 bytes

backup_restore_progress_trace 2019-06-18 11:17:01.9238444 +00:00 10 percent (54853632/542920704 bytes) processed

backup_restore_progress_trace 2019-06-18 11:17:01.9810017 +00:00 MediaFamily(0): FID=2, VLFID=635, DataStreamSize=16777216 bytes

backup_restore_progress_trace 2019-06-18 11:17:02.0323014 +00:00 15 percent (82116608/542920704 bytes) processed

backup_restore_progress_trace 2019-06-18 11:17:02.0498153 +00:00 MediaFamily(0): FID=2, VLFID=636, DataStreamSize=16777216 bytes

backup_restore_progress_trace 2019-06-18 11:17:02.1195952 +00:00 MediaFamily(0): FID=2, VLFID=637, DataStreamSize=16777216 bytes

backup_restore_progress_trace 2019-06-18 11:17:02.1464469 +00:00 20 percent (109379584/542920704 bytes) processed

backup_restore_progress_trace 2019-06-18 11:17:02.1877744 +00:00 MediaFamily(0): FID=2, VLFID=638, DataStreamSize=16777216 bytes

backup_restore_progress_trace 2019-06-18 11:17:02.2570845 +00:00 25 percent (136642560/542920704 bytes) processed

backup_restore_progress_trace 2019-06-18 11:17:02.2573724 +00:00 MediaFamily(0): FID=2, VLFID=639, DataStreamSize=16777216 bytes

backup_restore_progress_trace 2019-06-18 11:17:02.3263001 +00:00 MediaFamily(0): FID=2, VLFID=640, DataStreamSize=16777216 bytes

backup_restore_progress_trace 2019-06-18 11:17:02.3702739 +00:00 30 percent (163905536/542920704 bytes) processed

backup_restore_progress_trace 2019-06-18 11:17:02.3941585 +00:00 MediaFamily(0): FID=2, VLFID=641, DataStreamSize=16777216 bytes

backup_restore_progress_trace 2019-06-18 11:17:02.4635771 +00:00 MediaFamily(0): FID=2, VLFID=642, DataStreamSize=16777216 bytes

backup_restore_progress_trace 2019-06-18 11:17:02.4768947 +00:00 35 percent (190119936/542920704 bytes) processed

backup_restore_progress_trace 2019-06-18 11:17:02.5315044 +00:00 MediaFamily(0): FID=2, VLFID=643, DataStreamSize=16777216 bytes

backup_restore_progress_trace 2019-06-18 11:17:02.5872516 +00:00 40 percent (217382912/542920704 bytes) processed

backup_restore_progress_trace 2019-06-18 11:17:02.6020868 +00:00 MediaFamily(0): FID=2, VLFID=644, DataStreamSize=16777216 bytes

backup_restore_progress_trace 2019-06-18 11:17:02.6732336 +00:00 MediaFamily(0): FID=2, VLFID=645, DataStreamSize=16777216 bytes

backup_restore_progress_trace 2019-06-18 11:17:02.7043113 +00:00 45 percent (244645888/542920704 bytes) processed

backup_restore_progress_trace 2019-06-18 11:17:02.7416025 +00:00 MediaFamily(0): FID=2, VLFID=646, DataStreamSize=16777216 bytes

backup_restore_progress_trace 2019-06-18 11:17:02.8128799 +00:00 MediaFamily(0): FID=2, VLFID=647, DataStreamSize=16777216 bytes

backup_restore_progress_trace 2019-06-18 11:17:02.8199368 +00:00 50 percent (271908864/542920704 bytes) processed

backup_restore_progress_trace 2019-06-18 11:17:02.8834042 +00:00 MediaFamily(0): FID=2, VLFID=648, DataStreamSize=16777216 bytes

backup_restore_progress_trace 2019-06-18 11:17:02.9338510 +00:00 55 percent (299171840/542920704 bytes) processed

backup_restore_progress_trace 2019-06-18 11:17:02.9552501 +00:00 MediaFamily(0): FID=2, VLFID=649, DataStreamSize=16777216 bytes

backup_restore_progress_trace 2019-06-18 11:17:03.0292680 +00:00 MediaFamily(0): FID=2, VLFID=650, DataStreamSize=16777216 bytes

backup_restore_progress_trace 2019-06-18 11:17:03.0524488 +00:00 60 percent (326434816/542920704 bytes) processed

backup_restore_progress_trace 2019-06-18 11:17:03.0999388 +00:00 MediaFamily(0): FID=2, VLFID=651, DataStreamSize=16777216 bytes

backup_restore_progress_trace 2019-06-18 11:17:03.1645396 +00:00 65 percent (353697792/542920704 bytes) processed

backup_restore_progress_trace 2019-06-18 11:17:03.1683370 +00:00 MediaFamily(0): FID=2, VLFID=652, DataStreamSize=16777216 bytes

backup_restore_progress_trace 2019-06-18 11:17:03.2374707 +00:00 MediaFamily(0): FID=2, VLFID=653, DataStreamSize=16777216 bytes

backup_restore_progress_trace 2019-06-18 11:17:03.2742992 +00:00 70 percent (380960768/542920704 bytes) processed

backup_restore_progress_trace 2019-06-18 11:17:03.3044229 +00:00 MediaFamily(0): FID=2, VLFID=654, DataStreamSize=16777216 bytes

backup_restore_progress_trace 2019-06-18 11:17:03.3723517 +00:00 MediaFamily(0): FID=2, VLFID=655, DataStreamSize=16777216 bytes

backup_restore_progress_trace 2019-06-18 11:17:03.4062676 +00:00 75 percent (408223744/542920704 bytes) processed

backup_restore_progress_trace 2019-06-18 11:17:03.4598903 +00:00 MediaFamily(0): FID=2, VLFID=656, DataStreamSize=16777216 bytes

backup_restore_progress_trace 2019-06-18 11:17:03.5105134 +00:00 80 percent (434438144/542920704 bytes) processed

backup_restore_progress_trace 2019-06-18 11:17:03.5290138 +00:00 MediaFamily(0): FID=2, VLFID=657, DataStreamSize=16777216 bytes

backup_restore_progress_trace 2019-06-18 11:17:03.6010196 +00:00 MediaFamily(0): FID=2, VLFID=658, DataStreamSize=16777216 bytes

backup_restore_progress_trace 2019-06-18 11:17:03.6293332 +00:00 85 percent (461701120/542920704 bytes) processed

backup_restore_progress_trace 2019-06-18 11:17:03.6878991 +00:00 MediaFamily(0): FID=2, VLFID=659, DataStreamSize=16777216 bytes

backup_restore_progress_trace 2019-06-18 11:17:03.7633069 +00:00 90 percent (488964096/542920704 bytes) processed

backup_restore_progress_trace 2019-06-18 11:17:03.7636287 +00:00 MediaFamily(0): FID=2, VLFID=660, DataStreamSize=16777216 bytes

backup_restore_progress_trace 2019-06-18 11:17:03.8362761 +00:00 MediaFamily(0): FID=2, VLFID=661, DataStreamSize=16777216 bytes

backup_restore_progress_trace 2019-06-18 11:17:03.8837162 +00:00 95 percent (516227072/542920704 bytes) processed

backup_restore_progress_trace 2019-06-18 11:17:03.9154381 +00:00 MediaFamily(0): FID=2, VLFID=662, DataStreamSize=16777216 bytes

backup_restore_progress_trace 2019-06-18 11:17:03.9883764 +00:00 MediaFamily(0): FID=2, VLFID=663, DataStreamSize=3932160 bytes

backup_restore_progress_trace 2019-06-18 11:17:04.0073959 +00:00 100 percent (542920704/542920704 bytes) processed

backup_restore_progress_trace 2019-06-18 11:17:04.0187093 +00:00 Copying transaction log is complete

backup_restore_progress_trace 2019-06-18 11:17:04.0187231 +00:00 Writing the trailing metadata

backup_restore_progress_trace 2019-06-18 11:17:04.0188013 +00:00 BackupStream(0): Writing trailing metadata to the device C:\Program Files\Microsoft SQL Server\MSSQL14.MSSQLSERVER\MSSQL\Backup\AdventureWorks2014_LogBackup_2019-06-18_06-16-59.bak

backup_restore_progress_trace 2019-06-18 11:17:04.0188753 +00:00 Writing the end of backup set

backup_restore_progress_trace 2019-06-18 11:17:05.1136445 +00:00 Resuming any halted Fulltext crawls

backup_restore_progress_trace 2019-06-18 11:17:05.1145570 +00:00 Writing history records

backup_restore_progress_trace 2019-06-18 11:17:05.1570406 +00:00 Writing history records is complete (elapsed = 43 ms)

backup_restore_progress_trace 2019-06-18 11:17:05.1571172 +00:00 BACKUP LOG finished

backup_restore_progress_trace 2019-06-18 11:17:05.1846587 +00:00 Acquiring U lock on the database

backup_restore_progress_trace 2019-06-18 11:17:05.1846855 +00:00 RESTORE DATABASE started

backup_restore_progress_trace 2019-06-18 11:17:05.1846983 +00:00 Acquiring X lock on the database

backup_restore_progress_trace 2019-06-18 11:17:05.1847096 +00:00 Acquired X lock on the database

backup_restore_progress_trace 2019-06-18 11:17:05.1848243 +00:00 Opening the backup set

backup_restore_progress_trace 2019-06-18 11:17:05.1929402 +00:00 Processing the leading metadata

backup_restore_progress_trace 2019-06-18 11:17:05.1941467 +00:00 Planning begins

backup_restore_progress_trace 2019-06-18 11:17:05.2423481 +00:00 Effective options: Checksum=0, Compression=0, Encryption=0, BufferCount=6, MaxTransferSize=1024 KB

backup_restore_progress_trace 2019-06-18 11:17:05.2423558 +00:00 Planning is complete

backup_restore_progress_trace 2019-06-18 11:17:05.2426545 +00:00 Beginning OFFLINE restore

backup_restore_progress_trace 2019-06-18 11:17:05.8613121 +00:00 Preparing containers

backup_restore_progress_trace 2019-06-18 11:17:05.9191974 +00:00 Preparing FileStream container: c:\data\imoltp_mod1

backup_restore_progress_trace 2019-06-18 11:17:06.1012537 +00:00 Prepared FileStream container: c:\data\imoltp_mod1

backup_restore_progress_trace 2019-06-18 11:17:06.1013026 +00:00 Containers are ready

backup_restore_progress_trace 2019-06-18 11:17:06.1842403 +00:00 Restoring the backup set

backup_restore_progress_trace 2019-06-18 11:17:06.1842624 +00:00 Estimated total size to transfer = 2909552640 bytes

backup_restore_progress_trace 2019-06-18 11:17:06.1855198 +00:00 Transferring data

backup_restore_progress_trace 2019-06-18 11:17:06.1856031 +00:00 FileHandleCache: Initial CacheSize: 48

backup_restore_progress_trace 2019-06-18 11:17:06.1883666 +00:00 BackupStream(0): Processing MSDA of size 8288 extents

backup_restore_progress_trace 2019-06-18 11:17:07.5410761 +00:00 5 percent (145752064/2909552640 bytes) processed

backup_restore_progress_trace 2019-06-18 11:17:08.9161089 +00:00 10 percent (291504128/2909552640 bytes) processed

backup_restore_progress_trace 2019-06-18 11:17:10.3224426 +00:00 15 percent (437256192/2909552640 bytes) processed

backup_restore_progress_trace 2019-06-18 11:17:11.4572357 +00:00 BackupStream(0): Completed MSDA

backup_restore_progress_trace 2019-06-18 11:17:11.4580438 +00:00 BackupStream(0): Processing PH6(filestream) data

backup_restore_progress_trace 2019-06-18 11:17:11.5794020 +00:00 BackupStream(0): Completed PH6(filestream) data

backup_restore_progress_trace 2019-06-18 11:17:11.5894867 +00:00 Waiting for log zeroing to complete

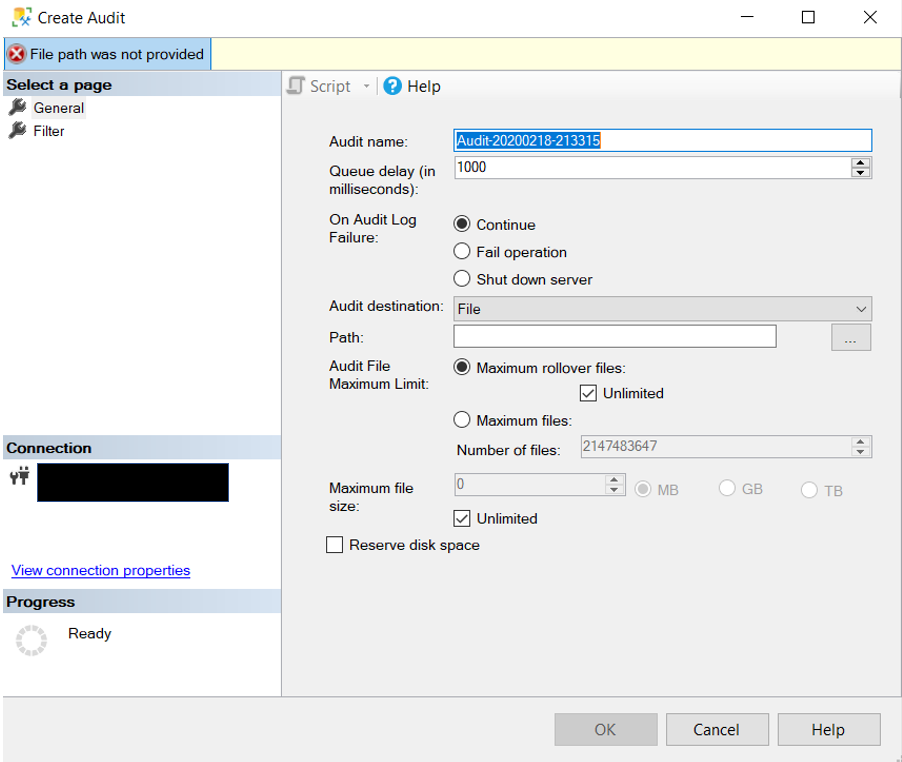
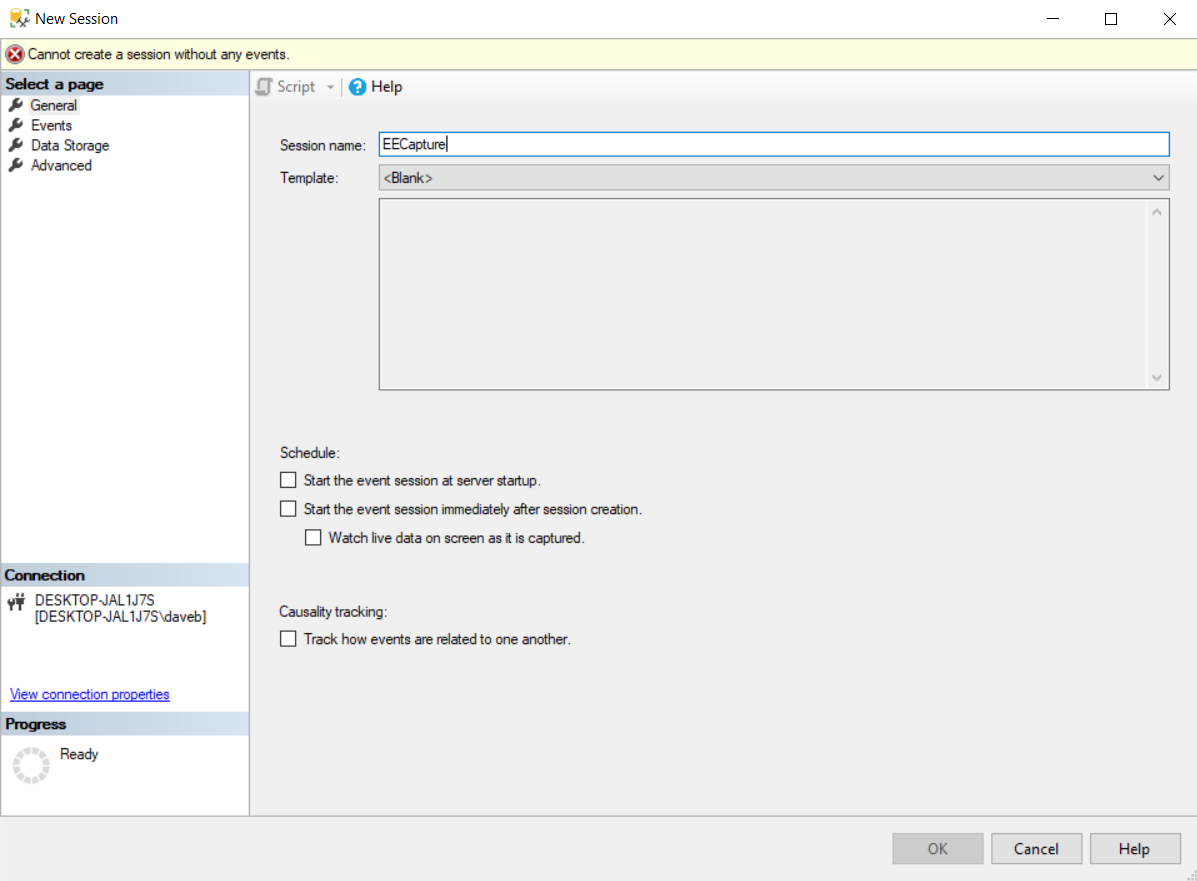
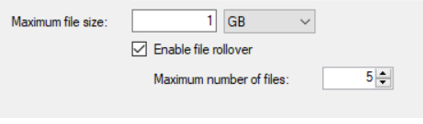
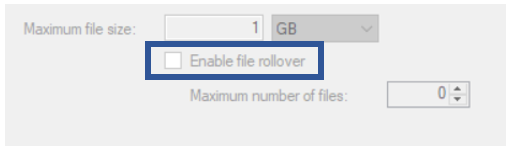
There are a lot more steps to a restore than I ever thought there would be.  If you are interested, here is the code I used to create the Extended Event session.  If you decide to use this, please make sure you change the name to something that works for you and change the path for the target files.

CREATE EVENT SESSION [RestoreDatabase] ON SERVER
ADD EVENT sqlserver.backup_restore_progress_trace(
ACTION(sqlos.worker_address,sqlserver.client_hostname,sqlserver.nt_username,sqlserver.sql_text))
ADD TARGET package0.event_file(SET filename=N‘RestoreDatabase’)
WITH (MAX_MEMORY=4096 KB,EVENT_RETENTION_MODE=ALLOW_SINGLE_EVENT_LOSS,MAX_DISPATCH_LATENCY=30 SECONDS,MAX_EVENT_SIZE=0 KB,MEMORY_PARTITION_MODE=NONE,TRACK_CAUSALITY=OFF,STARTUP_STATE=ON)
GO

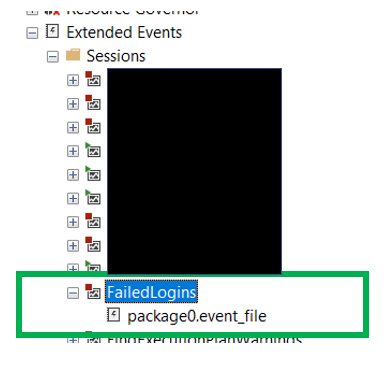
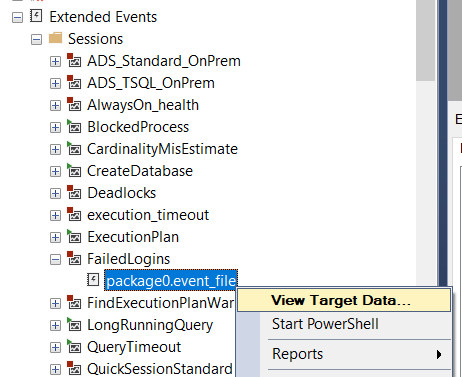
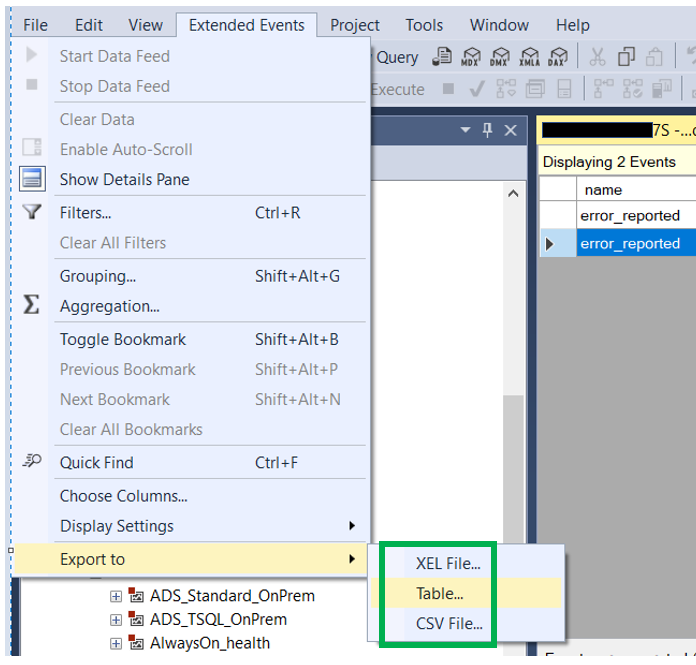
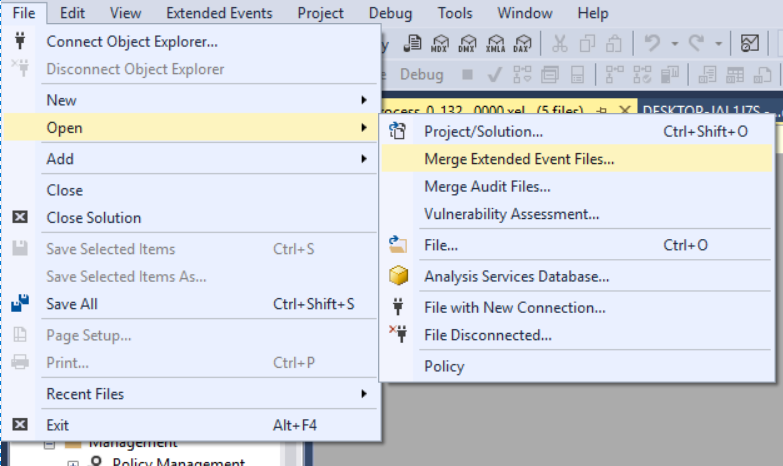
To read the data, you can utilize SSMS or use TSQL.  If you use SSMS, once you right click on the target and view the data, you can then go to the Extended Events menu item and at the bottom, you will see an option to Export the data.  With this, you can export the data to a table so you can then use TSQL to view the data.

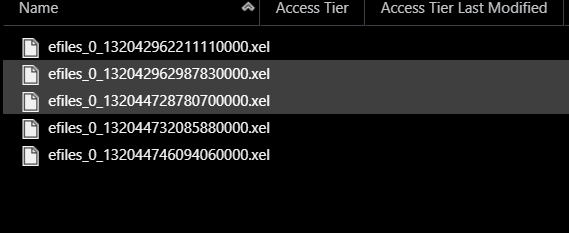
Or you can use the code below.  If you place the .xel file in a different location than the default, you will need to update the path to the files in the function, fn_xe_file_target_read_file.

SELECT event_data = convert(xml, event_data)
INTO #eeTable
FROM sys.fn_xe_file_target_read_file(N’RestoreDatabase*.xel’, null, null, null);

SELECT * FROM #eeTable

SELECT
ts = event_data.value(N'(event/@timestamp)[1]’, N’datetime’),
[StepDescription] = event_data.value(N'(event/date[@name=”trace_message”]/value)[1]’, N’nvarchar(max)’)
FROM #eeTable
ORDER BY ts

DROP TABLE #eeTable


Thanks for stopping by my blog!!!


Extended Events Session Filters in SSMS

Recently during a demo at a SQL Saturday the query to pull the Extended Event session data, didn’t return the expected results. The session I used for the demo was the create database statement.

Prior to the session, I deleted the Create Database session, however did not delete the target files because they are part of the demo.  Then I recreated the session, just as I had done before.  However, this time was there was a difference when I attempted to read the target data.  The entry for the newly created database was not showing up when I used the GUI, however was showing up when I read the XML.  During the session, I was not able to figure out why that was the case.

When I got home I did some more testing.  As I turns out, when I had done the same session the previous week at a different SQL Saturday, I created a filter for the data and that filter persisted, even though I had deleted the session and created it again.

So I decided to do some testing.  I made sure there were no longer any filters on the session data, then deleted the Create Database session.  Just to have a clean slate, I then restarted the SQL Server service.

Then I created two databases, test4 and test5.  As you can see below, they are both showing up when reading the event file using the GUI.

Then I added a filter to only show the test5 database by right clicking on the test5 value and then clicking, “Filter by this value”.

This resulted in only the test5 database showing in the grid.

Now that the session was up and running, I create another database, test6.   I restarted the Extended Event session to force the new database event to be written to the target.  Then I read the target again.  As you can see below, not only is test4 not showing up, but the newly created test6 is also not appearing.

I right clicked the test5 value and then to “Filter by this value”.  What I saw kind of surprised me a bit.  Below is a screenshot of what I saw, two entries for the test5 value.  This means that one had to exist before I tried to filter by the value again.

I clicked the Clear All button, and sure enough, all three databases now appear.  Just as in the image below.

What I found interesting is that the filter persists, even after deleting the session and creating it again.  Of course, deleting sessions is not a common task and recreating it with the same name and storing the target files in the same location is even less likely to happen.  However, I did find this interesting.


Thanks for stopping by my blog!!!!

Create Database Event – When does it fire?

Recently when presenting my Extended Event session at a SQL Saturday an attendee asked if the Create Database session I used as a demo would pick up the Tempdb that is recreated at start up. The answer is that it will not.  But this question got me thinking, what about a restore or attaching a database, would the event pick that up?

I have to admit, while I suspected that it would not pick up the TempDB creation, I was not 100% certain on whether or not the Create Database event fires on start up.  So I wanted to do a quick test and the answer is that the event does not fire when the SQL Server service is restarted.

What about when a database is attached?  When attaching a database, this event does indeed fire.  Which of course makes sense, at least to me, you are creating a new database when attaching the database files.

What about when a database is restored?  Although a restore is in reality a drop and recreate the database, it does NOT fire the Create Database event.  I tried both restoring the database with the same name and a different name and neither one was picked up by the Create Database event.

Thanks for visiting my blog!!!