Dm_os_performance_counters is a great Data Management View that I use quite often. You can find a ton of information that can help you identify performance bottlenecks in your system. It can be used to view Page Life Expectancy, Free list stalls/sec, Lazy writes/sec, Batch Requests/sec, SQL Compilations/sec, SQL Re-Compilations/sec, Cursor Requests/sec, Checkpoint pages/sec as well many other key data points. All of which can play a role in the effective identification of performance bottlenecks.
First of all, let’s cover a bit of background on this DMV. It has been around since SQL Server 2008 and will work in Azure SQL Database as well as Azure SQL Data Warehouse. Although in the Azure SQL Data Warehouse it has a slightly different name, sys.dm_pdw_nodes_os_performance_counters. The use of the DMV requires view server state permissions. There are a number of columns that are important, object_name and counter_name are just a couple. There is a column named cntr_type column. This is the column that will help us identify the type of each counter.
There are five counter types, although we will only discuss two of them here. You can find more information on the other types here, link. The first one has a counter type value of 27269576. This counter type is cumulative since the last time the SQL Server service was started. An example of this type of counter is Batch Request/sec.
The other counter type have a value of 65792. This counter type is the value as it stands right now. An example of this is Page Life Expectancy, which changes constantly as normal activity takes place on the server.
This post focuses on the counter type that is cumulative. The challenge that this counter type presents is that although it may be a value greater than 0, it is something that may not be happening at this point in time. This is what we need to determine, is this still happening or did it happen in the past.
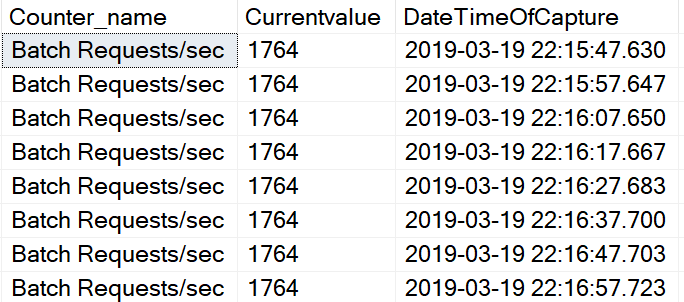
Free List Stalls/sec is an example of this counter type. This counter is one of several that can help us determine if there is memory pressure on the server. If the current value is 30,000 and the service was last restarted 3 months ago, we don’t really know when these took place. So what we want to do is determine if they are still happening. This is where the PIVOT can help. If you simply pull from the DMV you will get a single row for many of these types of counters. Even if you use the WAITFOR to capture the value multiple times and place it into a table, it will look something like this. Notice each row is 10 seconds apart.
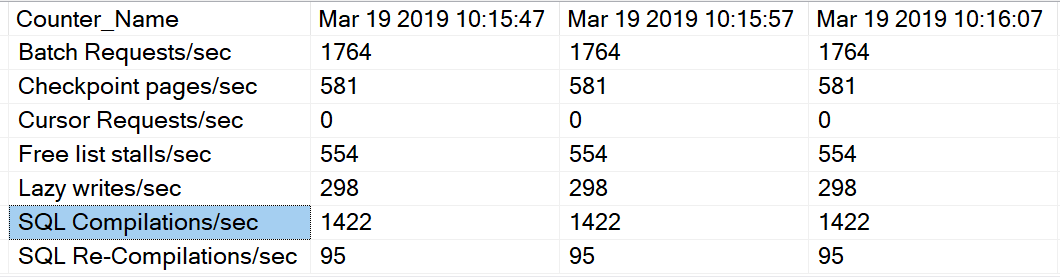
I think this presents a few challenges, the biggest being how can I easily tell if the event is still happening. Another challenge is when you have two counters that should be looked at as a pair, like Batch Requests/sec and SQL Compilations/sec. I want to be able to easily look at the data and see the values as they change over a period of time. I want it to look something like this. The counter names on the left and the times of capture along the top. As you can see, in this example the capture of the data took place every 10 seconds.
This can be accomplished by using the PIVOT command. The first thing we do is to declare a counter variable and a table to store the values.
DECLARE @iCount AS SMALLINT
CREATE TABLE #CounterValues
( Counter_name VARCHAR(50)
, Currentvalue INT
, DateTimeOfCapture DATETIME)
Then set the counter variable to 1, although you can set this to 0 if you like. This variable will server as our counter so the WHILE knows when to stop.
SET @iCount = 1
The next step is to write the code to capture the counter values and insert the data it the temporary table created above. Because we need to capture the values over a period of time, the WAITFOR DELAY is used. In this case the delay is 10 seconds, although you can change this to suit your needs. Of course, don’t forget to increment the counter variable. You will need to determine what counters you would like to capture. Notice in the WHERE clause, we are looking for an instance_name of ” or ‘_total’. This will allow the code to only capture one row for each counter. The number 10 is the number of times we want to capture the counter values. If you want to capture the data more frequently, simpley modify the number of seconds in the WAITFOR DELAY. Here is link to my post in this topic, WAITFOR.
WHILE @iCount < 10
BEGIN
INSERT INTO #CounterValues
SELECT Counter_Name
, cntr_value
, GETDATE()
FROM sys.dm_os_performance_counters
WHERE counter_name IN
( ‘Free list stalls/sec’
, ‘Lazy writes/sec’
, ‘Batch Requests/sec’
, ‘SQL Compilations/sec’
, ‘SQL Re-Compilations/sec’
, ‘Cursor Requests/sec’
, ‘Checkpoint pages/sec’)
AND instance_name IN (”,‘_total’)
WAITFOR DELAY ’00:00:10′
SET @icount = @icount + 1
END
Then we need to declare two variables, one to hold column names and the other to execute the dynamic SQL.
DECLARE @cols AS NVARCHAR(MAX)
DECLARE @query AS NVARCHAR(MAX);
Now we can into the meat of the PIVOT. We want to capture the column names from the time of each cycle of data capture above.
SET @cols = STUFF((SELECT DISTINCT ‘,’ + QUOTENAME(
CONVERT(VARCHAR(40),LEFT(CONVERT(CHAR(40),DateTimeOfCapture, 109) , 20))) AS DateTimeOfCapture
FROM #CounterValues
ORDER BY DateTimeOfCapture ASC
FOR XML PATH(”), TYPE
).value(‘.’, ‘NVARCHAR(MAX)’)
,1,1,”)
The above code will allow us to use the time of data capture as column headers as seen below.
If you print the @cols variable it will look something like this. You can see a series of dates with times separated with a comma. These values will now become the column names for our final result set.
[Mar 19 2019 11:17:00],[Mar 19 2019 11:17:10],[Mar 19 2019 11:17:20],[Mar 19 2019 11:17:30],[Mar 19 2019 11:17:40]
Now that we have our column names, let’s finishing up with the PIVOT. Because the column names are created dynamically, we will need to use Dynamic SQL to complete it.
SET @query = ‘SELECT Counter_Name,’ + @cols + ‘ from
(
SELECT Counter_Name, currentvalue, LEFT(CONVERT(CHAR(40),DateTimeOfCapture, 109) , 20) AS TimeOfCapture
FROM #CounterValues
) x
PIVOT
(
SUM(Currentvalue)
FOR TimeOfCapture IN (‘ + @cols + ‘)
) p ‘
EXECUTE(@query)
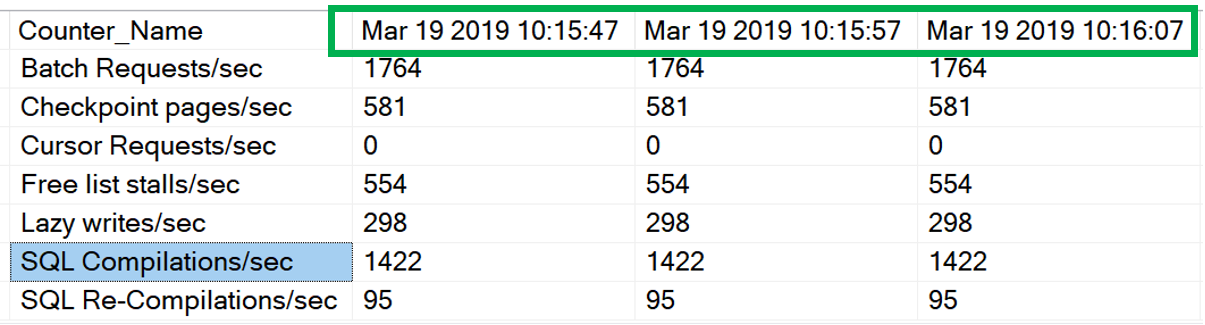
If you use these blocks of code together you will get what I think is the desired result. Notice the times across the top and the counter name on the left.
Here is a link to the complete code, PIVOTDMV.
Thank you for stopping by my blog and I hope you will find this useful!