For many years DBAs have been using Profiler to help with troubleshooting issues. This involved opening a second application name SQL Server Profiler. With Azure Data Studio we can now stay in one application by utilizing the SQL Server Profiler extension. Like most extensions, this one is still in preview and could change before final release.
The documentation states this, “The SQL Server Profiler extension provides a simple SQL Server tracing solution similar to SSMS Profiler except built using XEvents.”. This means that the SQL Server Profiler extension is using Extended Events instead of trace.
As stated earlier this is an extension, therefore will need to be installed. This is a pretty easy process. The first thing we need to do is to open the extensions window. This can be done under the View menu.
View –> Extensions
Once the extension window opens, do a search on “Profiler”. When you do you will see this.
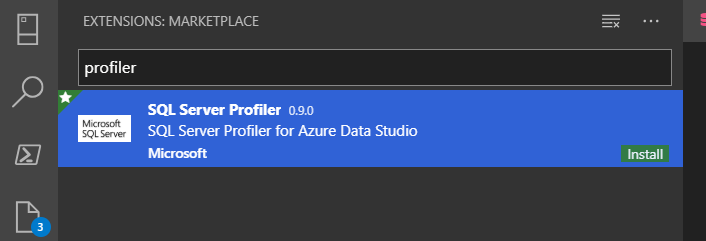
Once you find it, click the Install button you see above. This extension was created by Microsoft and is a very fast install. In addition, if you look at the above image, you will see a star in the upper left corner, this means that the extension is recommended by Azure Data Studio. You will not need to restart Azure Data Studio once the installation is complete.
The shortcut of the Profiler extension is ALT + p. If you use the short cut before you have installed the extension, you will still see something that appears to be profiler even though it is not. The image below is a screenshot. Notice that the tab says Profiler, yet the sessions are all the Extended Events sessions that are on the server I am connected to, so this really isn’t Profiler, even though it might look like it. Just a side note, if you have the proper permissions, you can start and stop Extended Event sessions here.
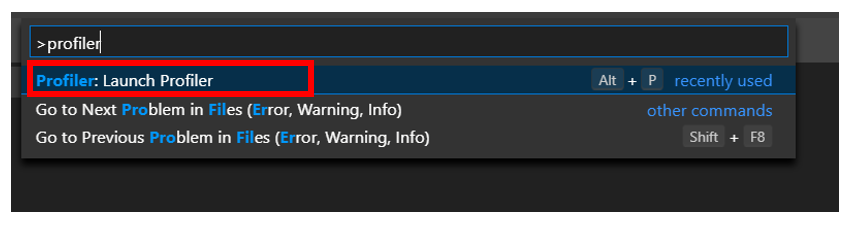
Once the Profiler Extension is installed there are two ways to open it. The first one and the easiest one is to use the shortcut, ALT + p. The second method is to utilize the Command Palett. This can be found under the View menu, should be the top item. When you open it, type the word “profiler” in the search and it will appear as below.
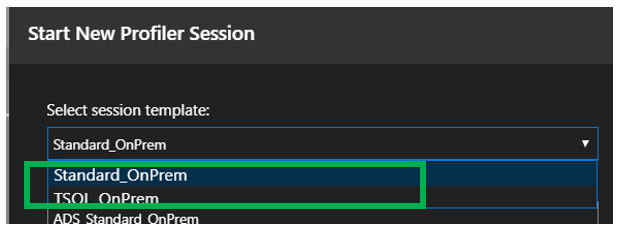
Once you open Profiler, if you do not have an active connection, you will be asked to create one. Then you will be taken to the screen below, which is the same screen you will be taken to if you have an active connection.
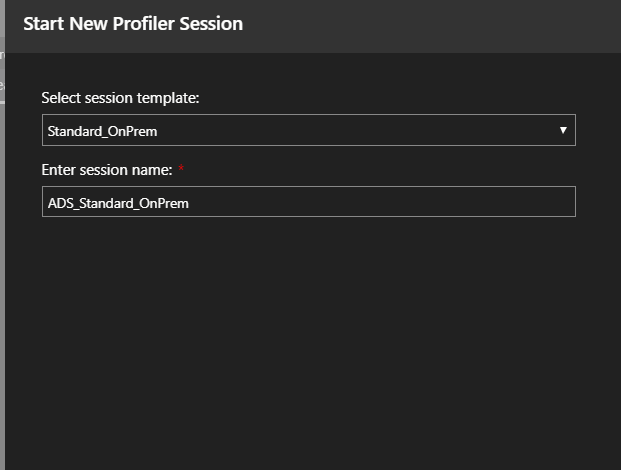
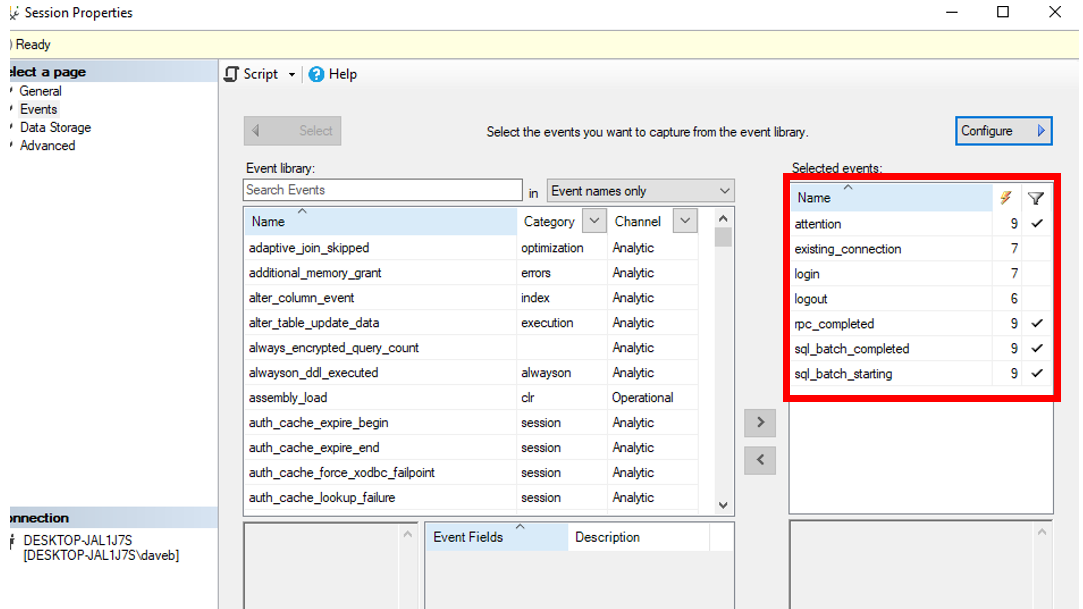
You will not be able to pick the events like you can in Profiler. At this point in time, it appears that you are limited to two profiles, TQL_OnPrem and Standard_OnPrem. Notice both say OnPrem, there is a third option when you connect to an Azure SQL Databases, Standard_Azure. Although there are three, you will only see the Standard_Azure template when connected to an Azure SQL Database.
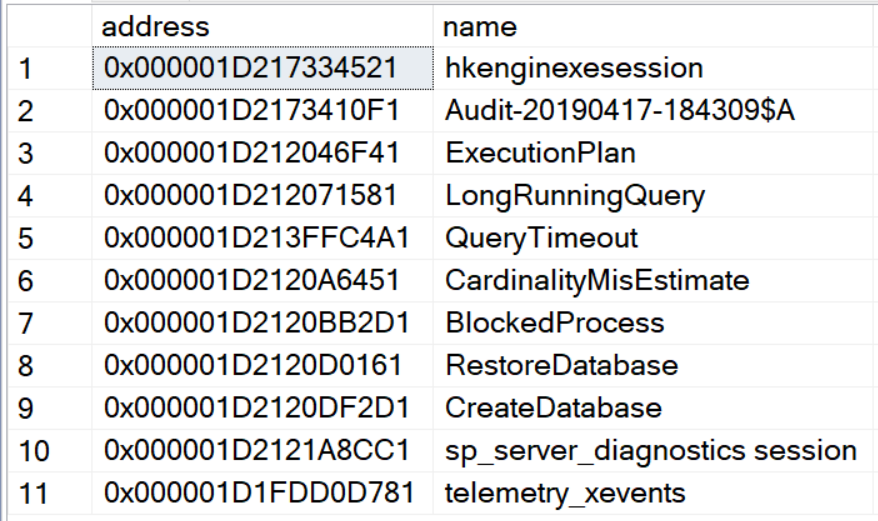
Earlier I mentioned that the Profiler is built on Extended Events. This is how you can see if a current session is running. Extended Events information is stored in a number of system tables and views. To see what Extended Events sessions are currently running you can use the code below.
SELECT *
FROM sys.dm_xe_sessions;
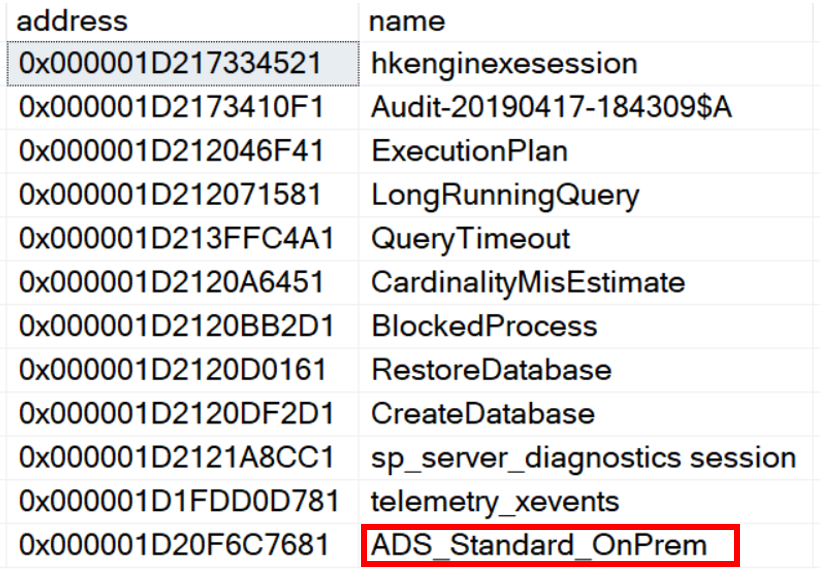
Your results will look similar to what is below.
Once I start the Profiler trace, I will see an additional session. Notice that the name starts with ADS. This will be the name you will see if you are using the TSQL Templete, ADS_TSQL_OnPrem. Once you stop the trace, this entry will disappear.
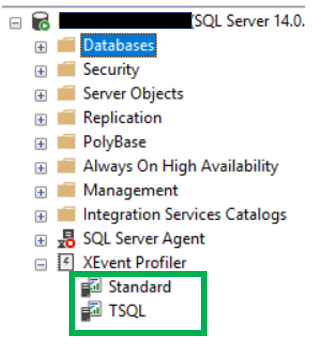
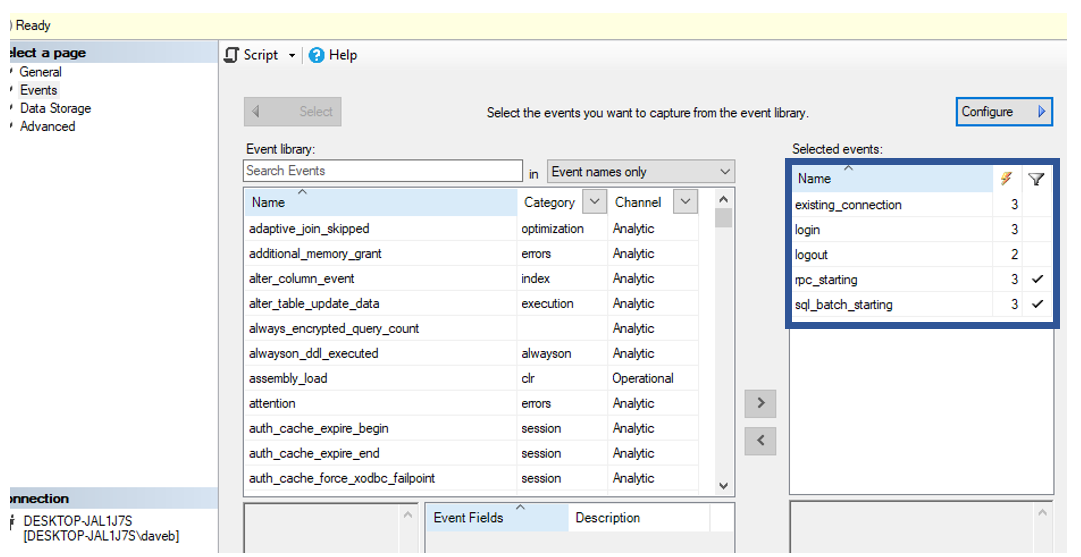
If you look at Extended Events in SQL Server Management Studio you will see two now sessions.
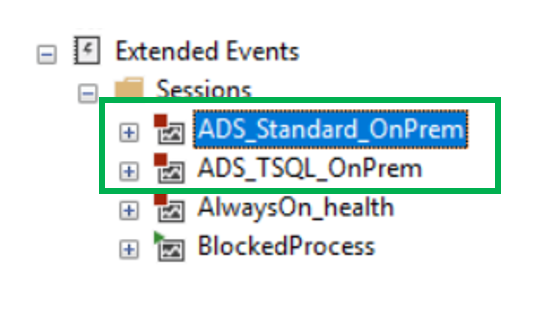
These names match up with the names you will see when you start Profiler in Azure Data Studio, just with ADS_ at the beginning.
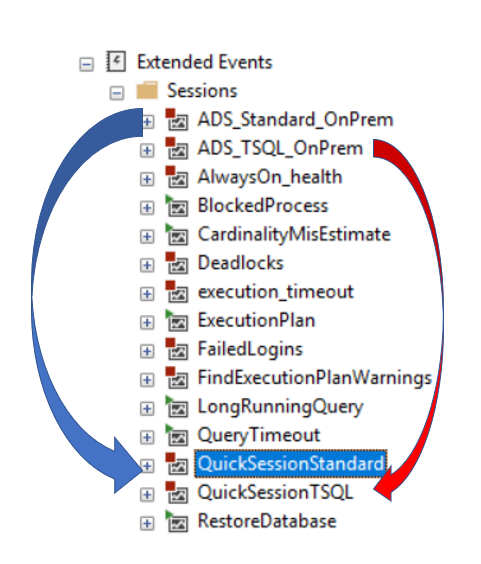
If you have used the XEvents Profiler in SQL Server Management Studio, these might look familiar. The sessions that XEvents Profiler creates are exactly the same as the ones created by the ADS Profiler, just a slightly different name. The image below shows that ADS and SSMS sessions that are the same.
Once the session starts you will see this across the top of the grid.
![]()
Going left to right, let’s briefly cover each item
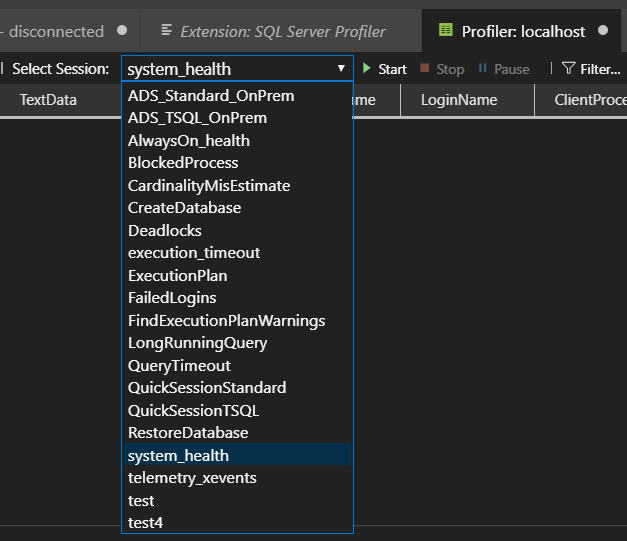
Select Session: This has a drop down box to the right. When a session is running, this drop down box is not available. However, if you stop the session, you will be able to pick a new sessions. The options include the two mentioned above as well as any Extended Event sessions that are currently on the server
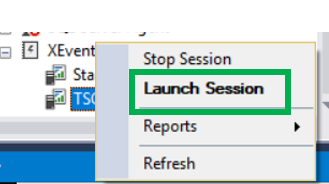
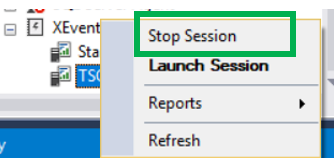
Start\Stop\Pause: These do exactly as you would think. Start a sessions, stop as session and pause a session
Filter\Clear Filter: This allows you to place a filter on the results. Here you can also save the filer, however I was struggling to get this to work properly.
Select View: Like the session label mentioned above, this also has a drop box to the right. However, for this, the items in the drop down list simply change what is displayed. When changing this, you will not only see a change the data that get’s captured, you will also see changes in the columns.
Autoscroll: This turns of the autoscroll
Clear Data: This is the farthest one to the right. Like a few of the other’s, this does exactly what it says it does, clears data.
Once you start collecting data, you will see a grid. If you look next to the EventClass header you will see a little green arrow. This is supposted to sort the data in a manny you decide. What I have found it that this works on some columns, while appearing that is doesn’t work on others.
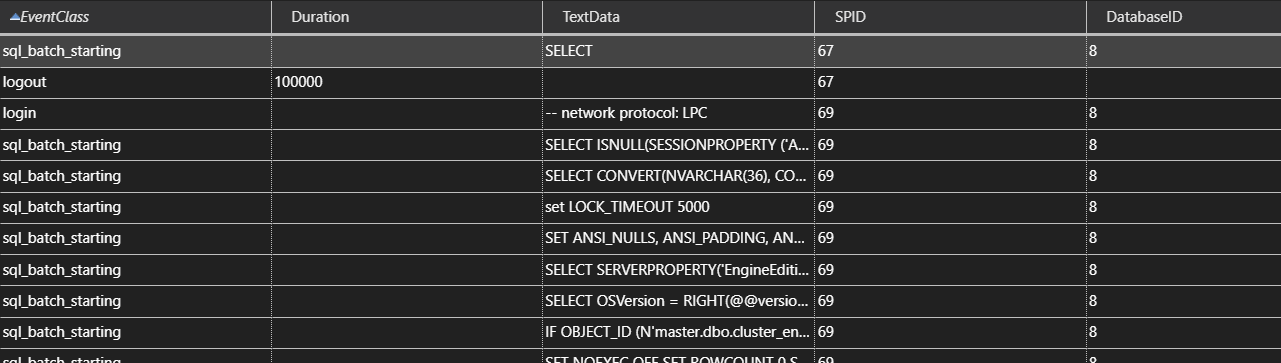
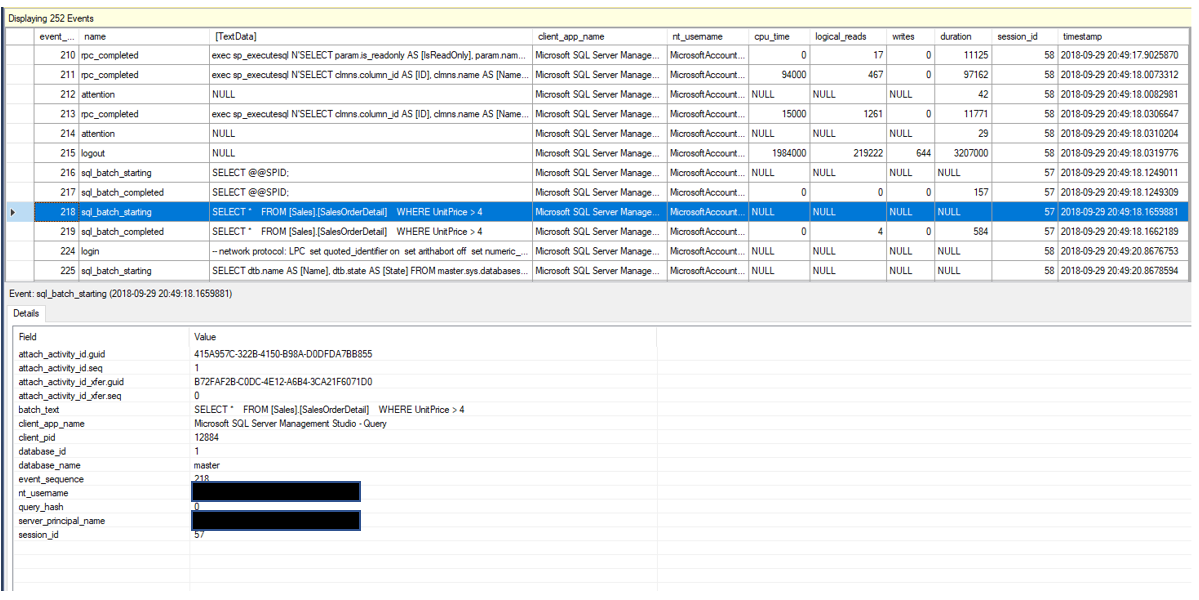
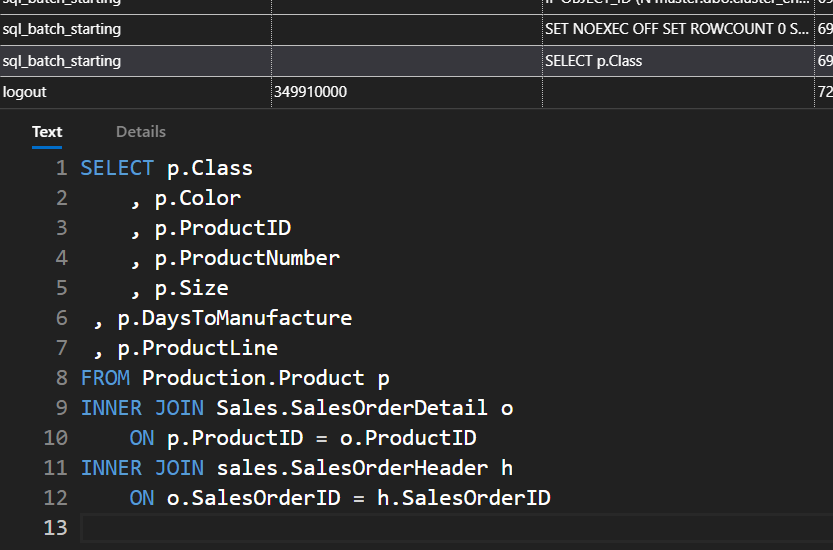
If you select a line in the grid, you will then see the Text and Details tabs in the bottom half. Similar to this screenshot. The text will simply return the query that was running, like below.
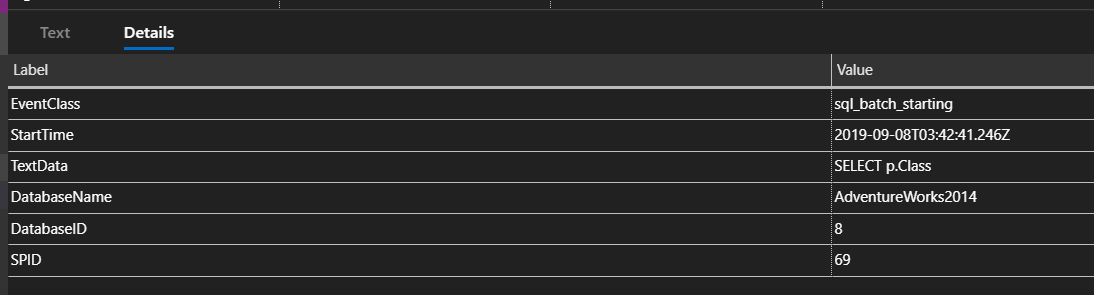
The Details tab will look similar to below. It will display the data for a the record that is selected in the grid.
There, now you are ready to use the Profiler extension. One of the limitations is that you do not have an option of where to save it. Just like the XEvent profiler in SQL Server Management Studio, the data here is somewhat temporary.
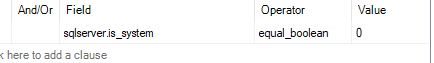
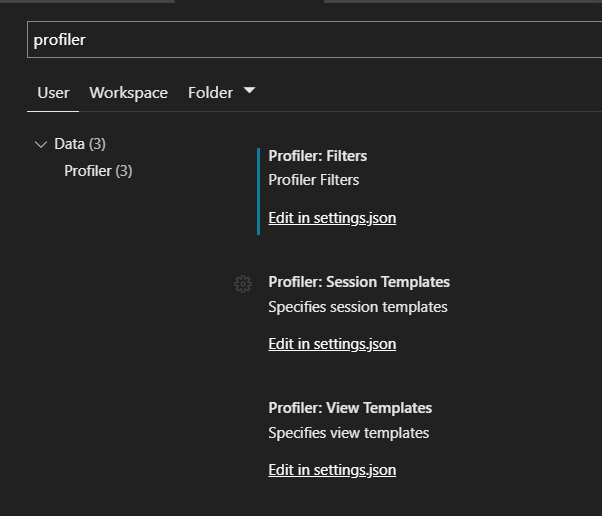
Earlier, I mentioned filters on the Profiler. While they do exist and they are easy to work with, I would be a good idea to know where the filter stored. The answer, is this filter is storted in the settings.json for Azure Data Studio. To see this we need to review the json file. The settings window can be opened by using the Preferences menu item under File. When you do a search for the word “Profiler” you will get the results as you can see below.
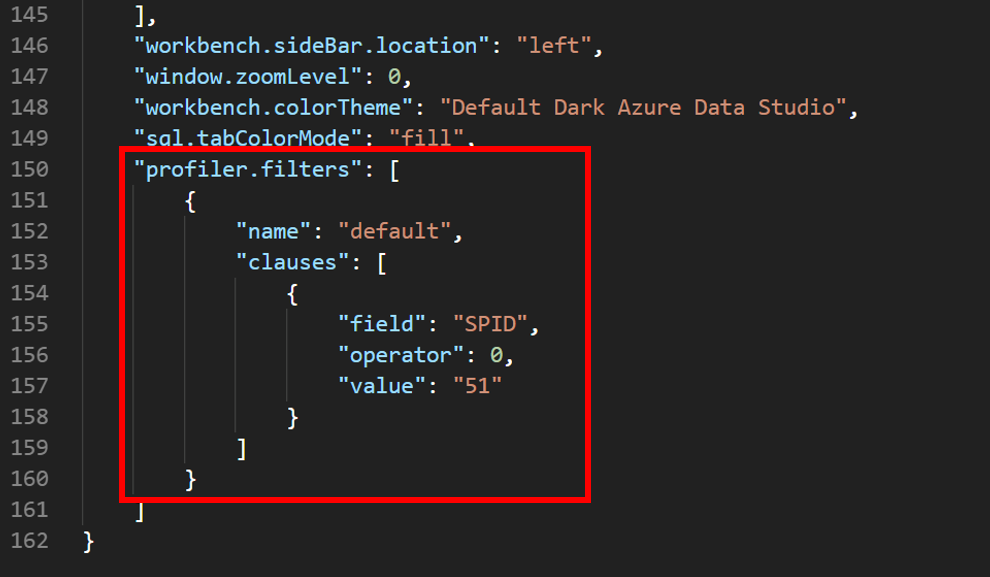
All the settings will require you work with the settings.json file. To get there simply click the link. In the image below, you can see that there is a setting that was saved by using the save functionality in the filters form. In this case the name is default, the field I want to filter it on is SPID and looking for a value equal to 51. For the operator, 0 is the value for equal, while the value for not equal to is 1.
You now have enough information to start using the Profiler extension. Over all, it isn’t bad, however because this is a function of a client application caution must be used. If there are a number of folks in your environment that have Azure Data Studio installed, you could have a number of folks running this at the same time. Given that the Profiler Extension is based on Extended Events, you should be aware that for the most part Extended Events are very lightweight, however if many people are doing this, there is a risk of causing a performance issue. So use…but use with a certain amount of caution.
Thank you for visiting my blog!!