As you know, when you are using an Azure SQL Database you can use SQL Server Management Studio on your computer to execute queries. You also have an option to use the Azure Query Editor. Here is my post on the query editor.
As I was writing the post I wondered more and more about whether or not there might be a difference in how data usage is billed. My thought was that since I am going from an Azure SQL database source to another Azure tool, Query Editor, could this potentially reduce my costs.
There are a number of Azure resources that have Egress as a metric that can be used to measure the amount of data that is being pulled from the Azure data center. These resources include the Azure Storage Account. However, an Azure SQL Database does not need to use a storage account.
Before we move on, let’s define what egress is.
Here is a definition of Egress from Microsoft:
“….data going out of Azure data centers” – Microsoft
I think the most important point the two definitions are trying to make is that egress is data going out of a data center, including if it is going from a data center in one region to a data center in another region. According to Microsoft, if there is a data pull and the database and the querying tool are both in the same region, you will not be billed. However, you will need to confirm this.
I am not planning on getting into the pricing models for Azure in this post, however you can get that from Microsoft. https://azure.microsoft.com
Although some resources have Egress to measure data, an Azure SQL Database does not. It does however have another option, DTU. DTU stands for Database Transaction Unit and it is a unit of measure that is used, in part, to calculate your bill and to help you chose the proper pricing tier for your database.
A DTU is a “blended measure of CPU, memory, and data I/O and transaction log I/O”, per Microsoft. The DTU is a measurement for the Azure SQL database only, not for your entire Azure environment or any other database. An important thing to keep in mind is that when your workload exceeds the DTU maximum for your pricing tier, Azure will then throttle your workload. My subscription currently has a max DTU of 10. As long as my workload stays below that I should be fine. Because of the potential of being throttled, it is important to monitor your work load. This is a nice article on the DTU by Andy Mallon.
If you are not sure what your workload might be in Azure, there are a number of DTU calculators available that can help. Here is a link to one, DTU Calculator.
As for the how many DTUs you can have, that will depend on the tier that you have chosen. Below is a sample of a chart from Microsoft that outline the limits of two of the tiers. Notice that there are a number of options for Max DTUs. Source of the chart is here. As you can see, the Max DTUs goes from 5 to 100. It even goes higher if you have are using the Premium tier.
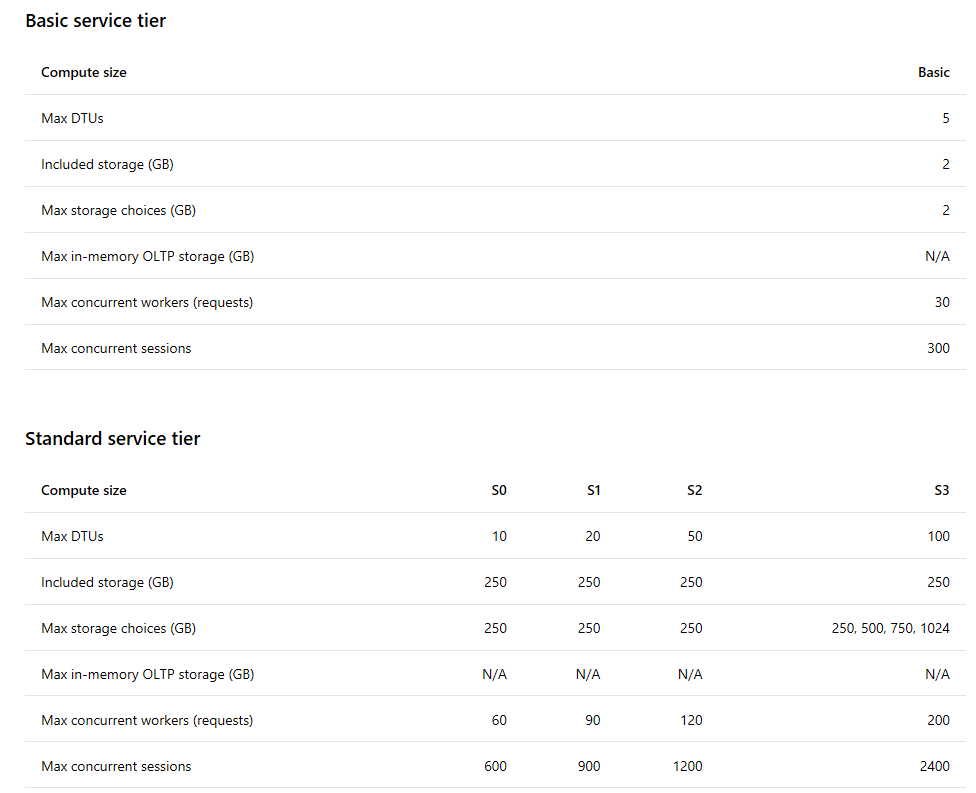
Per Microsoft, you have up to the Max DTU for your tier before you will be charged.
The DTU price for a single database includes a certain amount of storage at no additional cost. —Microsoft
Of course this might change at any moment, so I have to make a disclaimer. Always consult your MS rep or Licensing expert to get the exact pricing and rules.
As I stated earlier, it is important to monitor your work load to see if you are at a position in which you might be throttled. Azure is a pretty good set of monitoring reports that you can create. You can use the metrics reports to accomplish this. Here is a link to my post on how to create a metrics report.
So what should you monitor? Well since we are talking about an Azure SQL database, you have three options for measure DTUs.
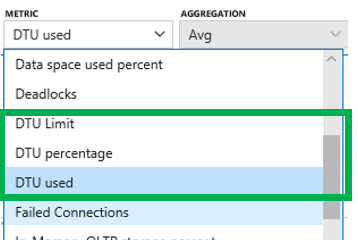
DTU Limit – this is what you think it might be, the limit for your tier.
DTU Percentage – this is just that, the percentage of the DTU max that is being used.
DTU Used – this is the current DTUs that are being your by your workload for the database.
This post is less about DTU calculation and pricing tiers and more about does it make a difference if I use SSMS or the Azure Query Editor on the use of DTUs.
From the tests that I have completed that answer is no. Using Azure Query Editor showed little or no improvement in the use to DTUs.
Before we get into the results of the test, let’s cover a few basics of what I did. I used the AdventureworksLT sample database that you can get from the Azure portal when creating a new sample database.
This is the query I ran this query using both tools.
SELECT TOP 100000 *
FROM saleslt.salesorderdetail a
CROSS JOIN saleslt.salesorderdetail b
In the chart below the green boxes represent the test using SQL Server Management Studio, while the blue boxes are the executions in the Azure Query Editor. Notice that there is very little difference in the DTU usage.
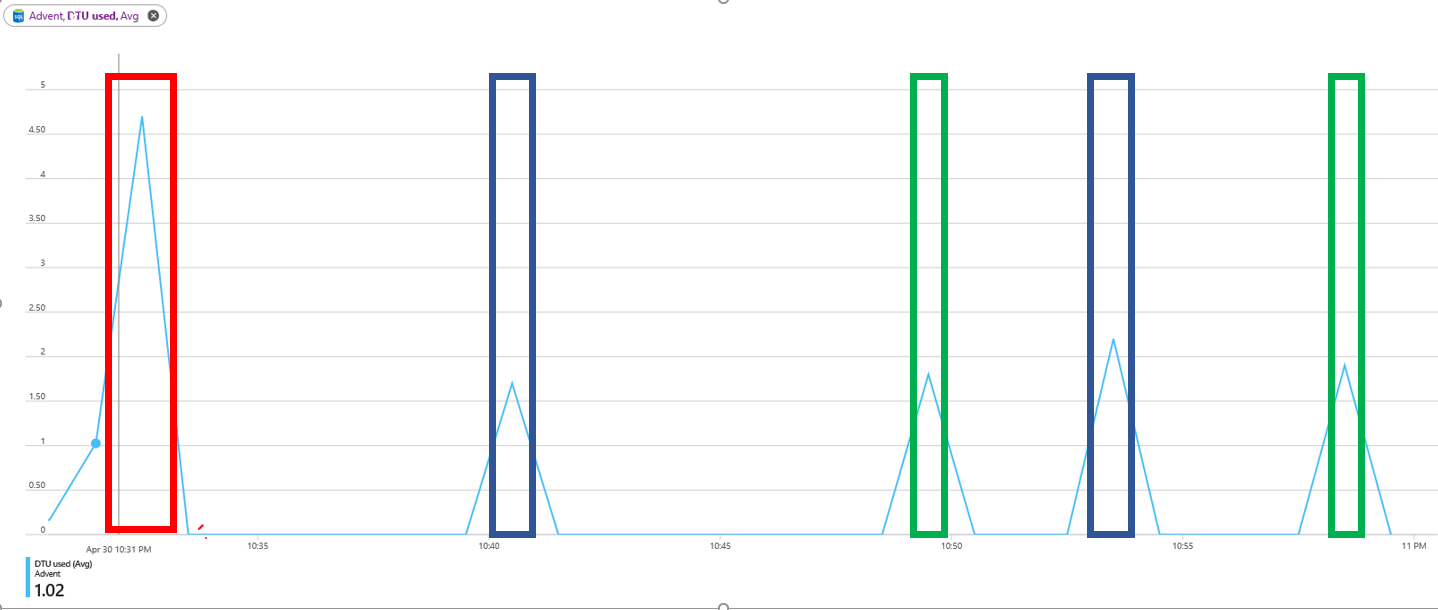
Although there really isn’t much difference in DTU consumption, I did notice something I didn’t really didn’t expect.
When I ran the query in SSMS is usually took less the 3 seconds to run. However, when I ran the same query using the Query Editor, it usually took 45 to 60 seconds. That is a huge difference. Also note that in the above chart, the Max DTU never reached 10, which is my limit. Because if this, I know that I was not throttled by Azure.
You might be wondering with the red box is. This is the test when I ran this query.
SELECT *
FROM saleslt.salesorderdetail a
CROSS JOIN saleslt.salesorderdetail b
The only difference it that it doesn’t have the TOP keyword. What is interesting about this is that when I ran the query in SSMS, it took about 45 seconds. However, when I ran in the Query Editor, it was pushing 5 minutes before I cancelled it.
How can I get information about the MAX DTU for the Azure SQL Database? There are a few DMVs that you can use. The first on is the dm_db_resource_stats. This can be used to the Max DTU, as well a number of other bits of useful information.
If you run this query in your Azure SQL Database you can get the information. The column you want to look for to get the Max DTU limit is DTU_limit. Here is a link to get more information on this DMV.
SELECT * FROM sys.dm_db_resource_stats;
However, if you try to run it in the Master database, you will get this error:
Msg 262, Level 14, State 1, Line 1
VIEW DATABASE STATE permission denied in database ‘master’.
Msg 297, Level 16, State 1, Line 1
The user does not have permission to perform this action.
You can also use he sys.resource_stats dmv to get the DTU limit. This DMV has the same column name as above, dtu_limit. This DMV must run in the Master database. Here is a link to get more information on this DMV.
SELECT * FROM sys.resource_stats
If you try to run it in another database, you will get this error.
Msg 208, Level 16, State 1, Line 3
Invalid object name ‘sys.resource_stats’
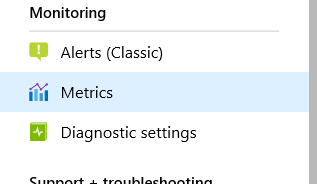
How do I get to the metrics report. This is pretty straight forward. Navigate to your Azure SQL Database in the portal.
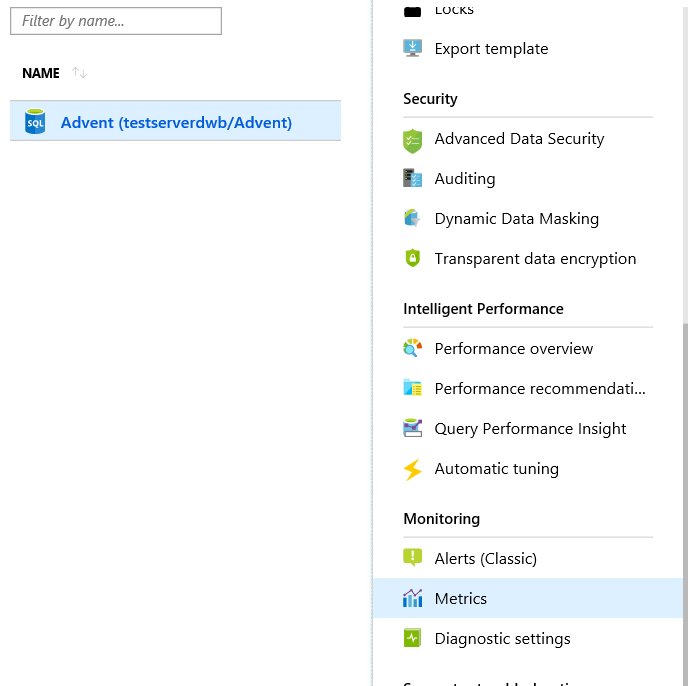
As you can see, in the menu on the side you will see the Metrics items. If you click it, You will then be taken to an Azure Reporting tool.
You will then create your report. This my post on the Metrics Report.
Thank you for stopping by and I hope you learned something.