Optimize for Ad Hoc Workloads is one of those server level settings that are not changed very often, but is still good to know about. Before we get into the details let’s talk about what it is. When using SQL Server, it reserves a portion of memory for Plan Cache. The Optimize for Ad Hoc Workloads setting controls what SQL Server places into this plan cache for single use queries. When it is turned off, all single use queries will have the entire plan cached, therefore consuming more space. By turning this on, you are asking SQL Server to not store the entire plan when the query is executed the first time, SQL Server will now only store a plan stub instead. Which consumes less memory than the full plan would. Something to keep in mind, the next time that the query is executed, it will flush the stub from the cache and replace it with the full plan.
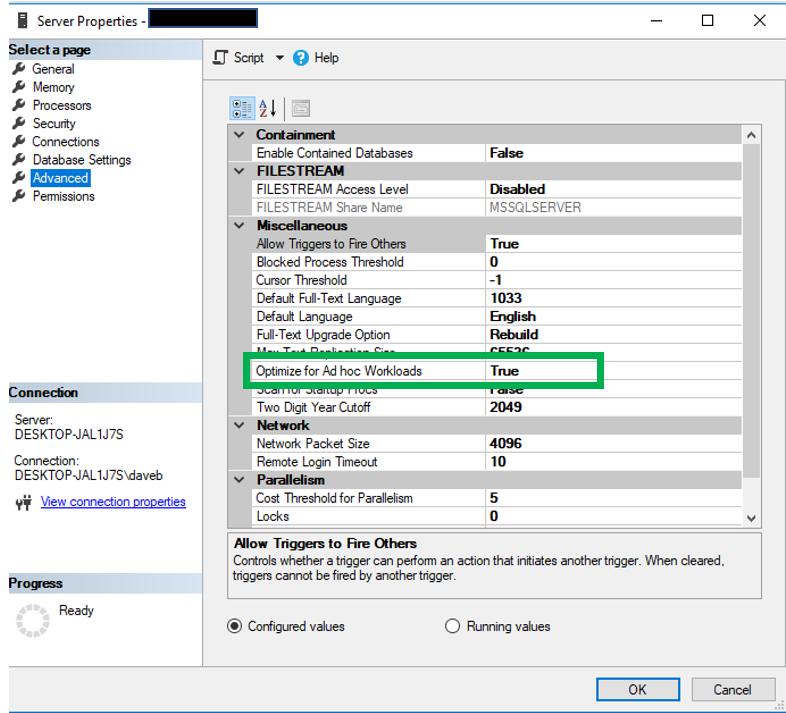
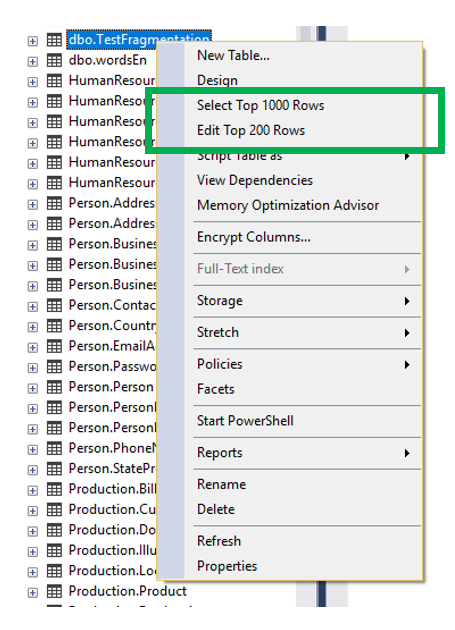
There are two methods you can use to determine if this setting is on or off. The first being SQL Server Management Studio(SSMS). In the Object Explorer right click on the server and then click on Properties. The default is False, meaning that the entire plan will be placed in cache when a query is compiled and executed.
As with many things in SQL Server, you can also use TSQL to get this information. You will need to query sys.Configurations to get this setting via TSQL.
SELECT name
, value
, description
FROM sys.configurations
WHERE Name = ‘optimize for ad hoc workloads’
Here is the result of the above query.

How to determine if there are a lot of Single use Queries in Cache
I think there are two measures we need to understand when it comes to finding out what is consuming the cache. One is the amount of space being consumed by Ad Hoc queries and the other is the number of queries that are considered to be Ad Hoc queries.
Below is the Microsoft description of the dm_exec_cached_plans DMV. This DMV can be used to capture the amount of space consumed by Ad Hoc queries.
“Returns a row for each query plan that is cached by SQL Server for faster query execution. You can use this dynamic management view to find cached query plans, cached query text, the amount of memory taken by cached plans, and the reuse count of the cached plans.” – Microsoft
The code below uses the dm_exec_cached_plans to find out how much space in cache is being consumed by Ad Hoc queries.
From Pinal Dave:
SELECT
AdHoc_Plan_MB, Total_Cache_MB,
AdHoc_Plan_MB*100.0 / Total_Cache_MB AS ‘AdHoc %’
FROM (
SELECT SUM(CASE
WHEN objtype = ‘adhoc’
THEN CONVERT(BIGINT,size_in_bytes)
ELSE 0 END) / 1048576.0 AdHoc_Plan_MB,
SUM(CONVERT(BIGINT,size_in_bytes)) / 1048576.0 Total_Cache_MB
FROM sys.dm_exec_cached_plans) T
Below you will see the results of the above query. Note that only 2.8% of the cache is being consumed by Ad Hoc queries.

So now let’s see how many Ad Hoc query plans are currently in cache. The query below used a few additional funtions, sys.dm_exec_sql_text and sys.dm_exec_query_plan, both of which accepts the plan handle as an argument value.
SELECT SUM(c.usecounts)
, c.objtype
FROM sys.dm_exec_cached_plans AS c
CROSS APPLY sys.dm_exec_sql_text(plan_handle) AS t
CROSS APPLY sys.dm_exec_query_plan(plan_handle) AS q
GROUP BY c.objtype
The results are below

By looking at these two result sets you can see that although there are 2,542 Ad Hoc query plans in cache, they are consuming a small percentage of the total cache, 2.8%.
So what does this mean? Well, although there are a lot of Ad Hoc queries, if the server is suffering from pressure in memory or in the plan cache, it is probably not due to the Ad Hoc queries.
How do I get the Query Plan
There is a post at www.sqlshack.com that gives really good explanation on how to get the query plan.
This code from the above link. It not only tells us the query text and the plan, but also gives us the number of times that plan was used.
SELECT cplan.usecounts
, cplan.objtype
, qtext.text
, qplan.query_plan
FROM sys.dm_exec_cached_plans AS ‘cplan’
CROSS APPLY sys.dm_exec_sql_text(plan_handle) AS ‘qtext’
CROSS APPLY sys.dm_exec_query_plan(plan_handle) AS ‘qplan’
ORDER BY cplan.usecounts DESC
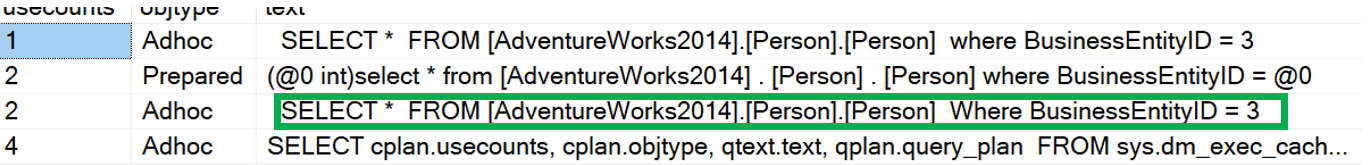
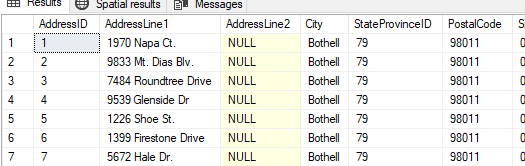
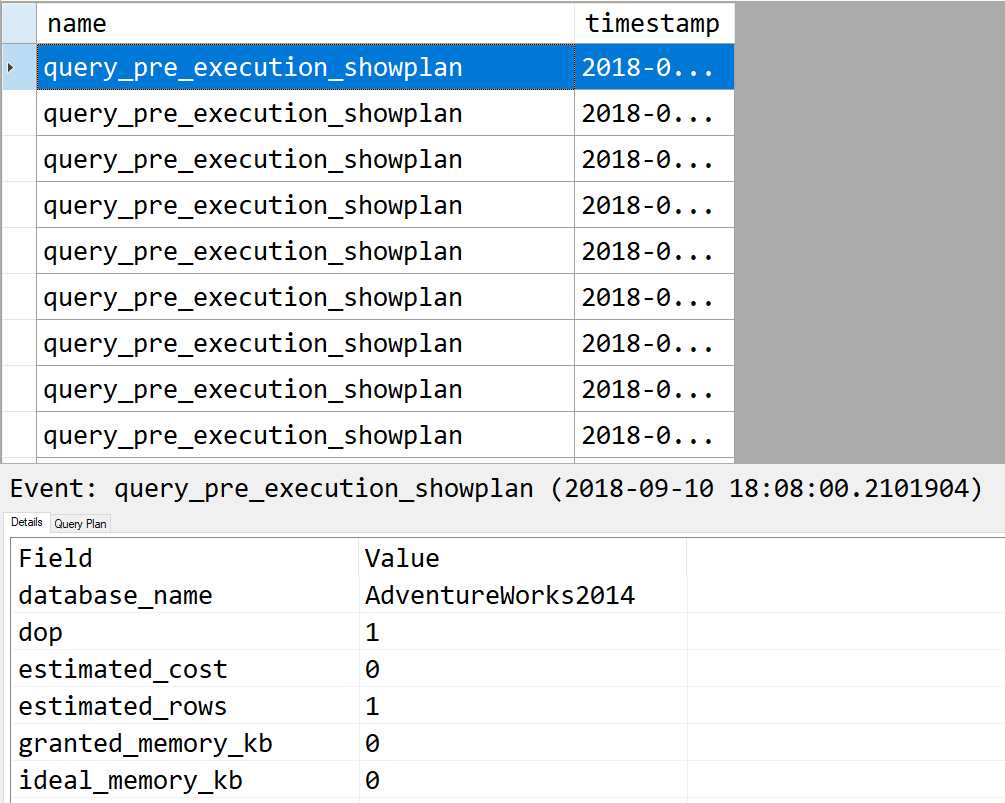
Below is the result set from the above query. With this, I can review the query and the execution plan for the Ad Hoc query.
Clear Cache
Of course, restarting the SQL Server service will clear the cache, however there is also a method we can used to clear the cache without restarting. We can use the code below.
DBCC FREEPROCCACHE
When the cache is cleared, whether by a reboot or using the above command, you should let the server run for a bit to let the cache get reloaded with plans.
Does Case Matter?
When talking about the plan cache, case does matter. However, they will both result in the same execution plan.
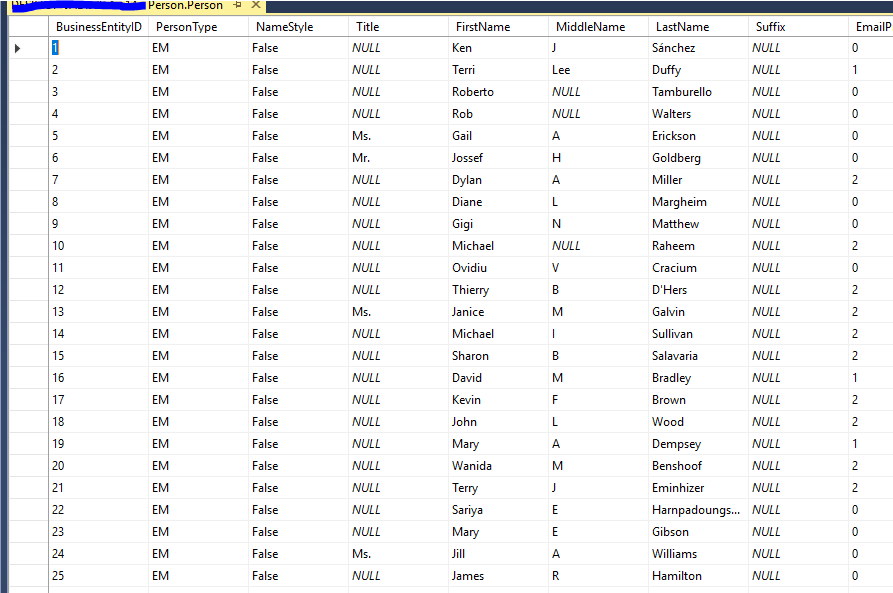
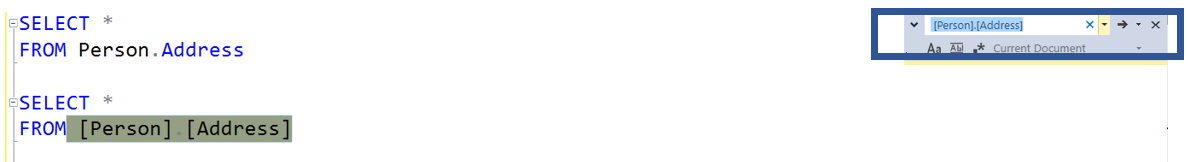
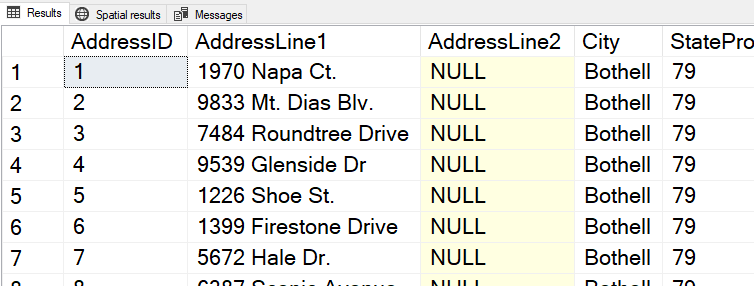
Using the AdventureWorks2014 database, when you run the following query you will see the plan in cache.
SELECT *
FROM [AdventureWorks2014].[Person].[Person]
Where BusinessEntityID = 3
The plan is below in the green box. If you look at the other queries, you will also see the same query with one small difference, the “w” in Where is lower case. Even though both queries will use the same Execution Plan. The reason this happens I because SQL Server creates a hash of the query and if the hash value exists in the cache, it will use that plan. However, because the “w” is a different case, the hash will also be different.
Let’s See it at Work
This is just a simple demo to show that when Optimize for Ad Hoc Workloads is turned on, the plan does not appear in the plan cache with the first execution, only the second.
First thing is to go to the properties of the server and make sure that the Optimize for Ad Hoc workloads is set to true. Once that is done flush the cache either by restarting the service or using DBCC FREEPROCCACHE.
Once that is done, run this code to confirm that there are not any plans in cache for the query we are about to run.
The query we are going to use is in the AdventureWorks2014 database:
SELECT * FROM Production.Product
Here is the code to check if there is already a plan in cache for this query. Make sure to change the database ID, it is 8 on the system I am using.
SELECT c.usecounts
, c.objtype
, t.text
, q.query_plan
FROM sys.dm_exec_cached_plans AS c
CROSS APPLY sys.dm_exec_sql_text(plan_handle) AS t
CROSS APPLY sys.dm_exec_query_plan(plan_handle) AS q
WHERE t.text LIKE ‘%select% *%’ AND q.dbid = 8
ORDER BY c.usecounts DESC
Once you run the above code, you will see something similar to the image below. Notice that there an entry for our query of the product table.
Now run the product table query. Once you do you will see something like below. As you can see not only is there a record for our query, but also a plan as well. This is because the Optimize for Ad Hoc workloads is turned off.
Now, set Optimize for Ad Hoc workload to true, flush the cache and let’s see what happens. Sure enough, no plan, just as before.
Run the following query:
SELECT * FROM Production.Product
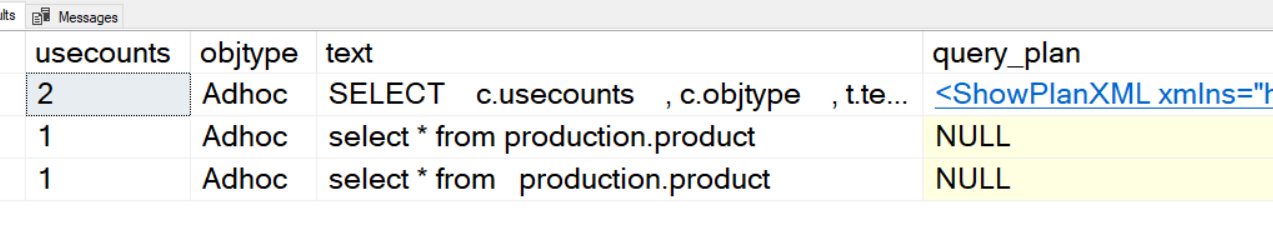
then the query to get the plans. When you do, you will see the record for the execution, but no plan.
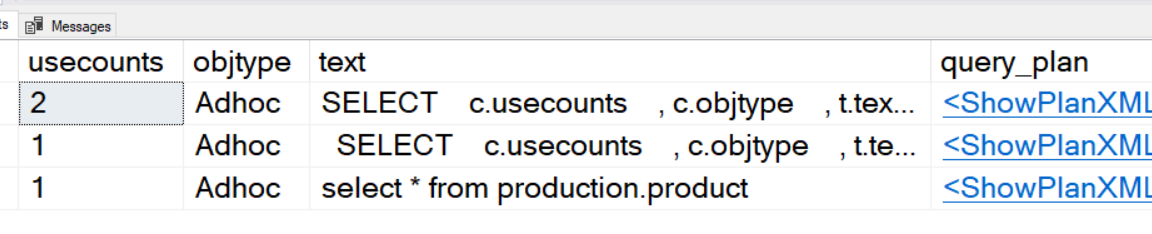
Run the query for the products table a second time. Now you will see the plan is also in cache. This is because the Optimize for Ad Hoc Workloads, when set to True only stores a stub in the cache on the first execution of a query, then the entire plan on the second execution.
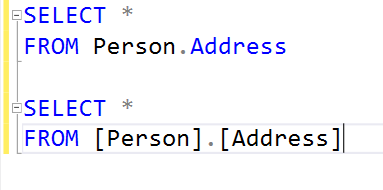
As mentioned earlier in this post, spaces and case do make a difference when SQL Server queries the plan cache. Notice below that there are two rows for what appears to be the same query. However, if you look closer, you will see that the second query actually has an additional space between FROM and the table name. This results in a different hash, and then results in a different entry in the plan cache.
Given all the information should I turn the on or off?
Well, that is a good question. In my option, unless you have evidence that there is pressure in the cache, I would leave it at the default setting. I have never actually had a need to change this setting, but am open to it if there is evidence it would benefit the overall performance of the server. So let’s take a look at what others say.
“I can’t really give you a situation that I would expect to see where this shouldn’t be enabled honestly. There are theoretical examples out there – maybe a series of queries – lots of them – with reusable plans executed only twice. Or something like that. I answer a lot of questions on DBA.StackExchange – it’s a great site in a great network and the consensus there seems to generally be that it almost always makes sense in this answer. When I do a SQL Server Health assessment? I want to see that enabled.`”
Kendra Little Says this on her blog:
“Arguing about this setting is a lot like arguing about whether or not it’s better to put cream in your coffee: if the coffee is decent, it probably tastes fine either way.
My general preference is to not turn on a setting unless I have a good reason to believe that it will make a positive difference, so I don’t turn this on by default. Instead, I’d rather monitor the number of single use plans in cache, and investigate and act accordingly if that number starts spiking upwards.
But admittedly, that’s being fussy: if I had a flock of 1,000 SQL Servers to manage myself and I knew they were all patched to recent supported versions, I’d probably enable it on them all and I wouldn’t feel a bit bad about it, because I wouldn’t have the bandwidth to do it the very best, artisanal, hand-crafted way.”
Pinal Dave states this on his blog:
“Based on the result you can make your own conclusion and change your settings. I, personally, prefer to turn Optimize for Ad Hoc Workloads settings on when I see AdHoc Percentages between 20-30%. Please note that this value gets reset when you restart SQL Server services. Hence, before you change the settings, make sure that your server is up for a quite a few days.
If you are not sure, what to do, just reach out to me with the result and I will be happy to help you.
One final note, This is just one settings, which contributes to your SQL Server Performance”
I tend to be more in line with what Pinal Dave is saying with the understanding that this is only one setting, however all three make very valid points. You need to look at the big picture and decide for yourself on what the best settings is for your systems. There are a number of other SQL Server settings that could impact performance and you should review them all before making a change. You should look at the big picture for performance to determine if the server could benefit by changing this setting.
Thanks for stopping by my blog….

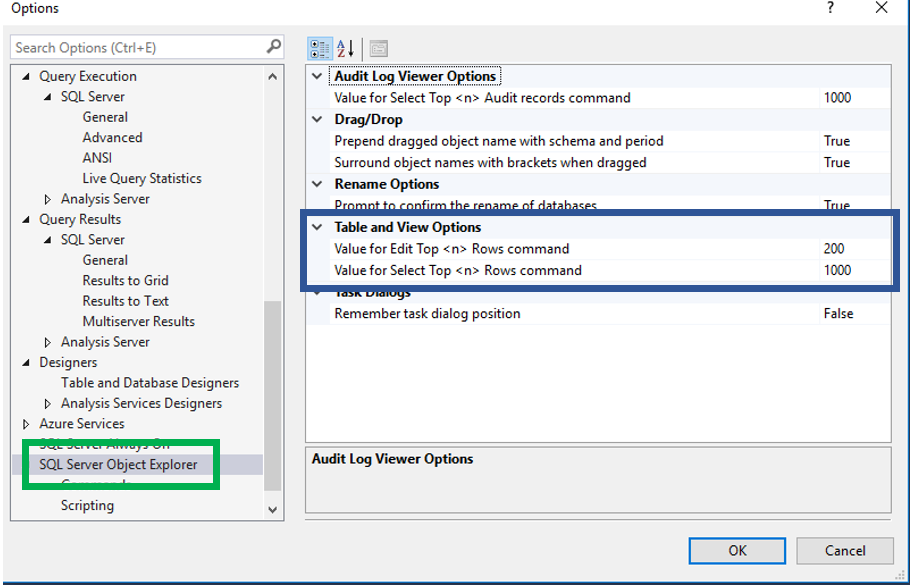

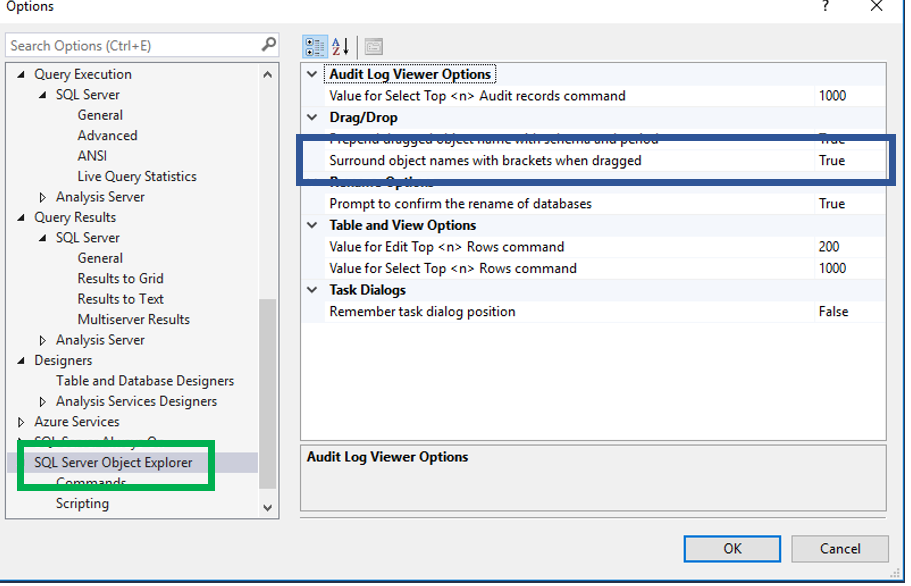


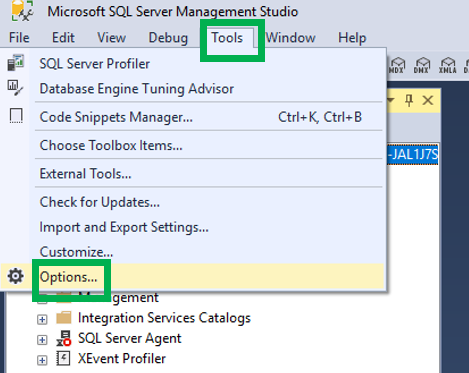
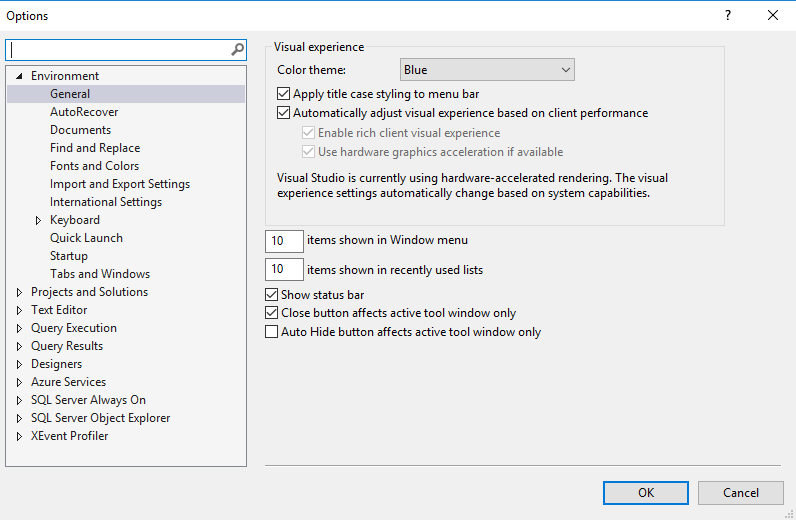
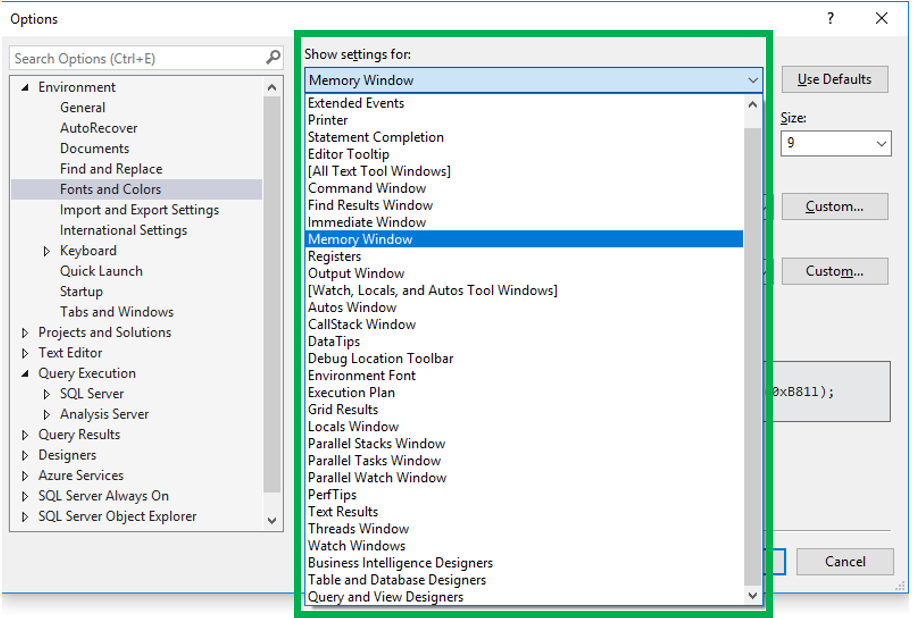
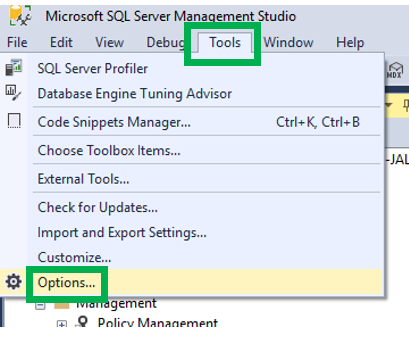 Once you click Options you will see this..
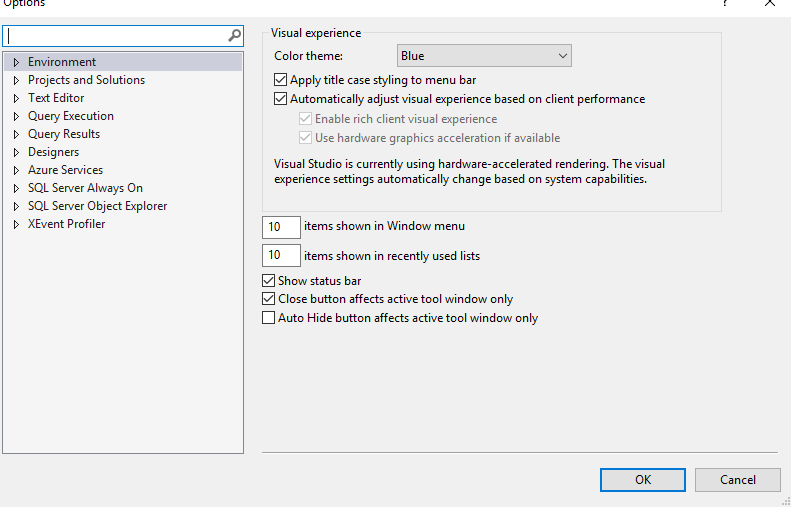
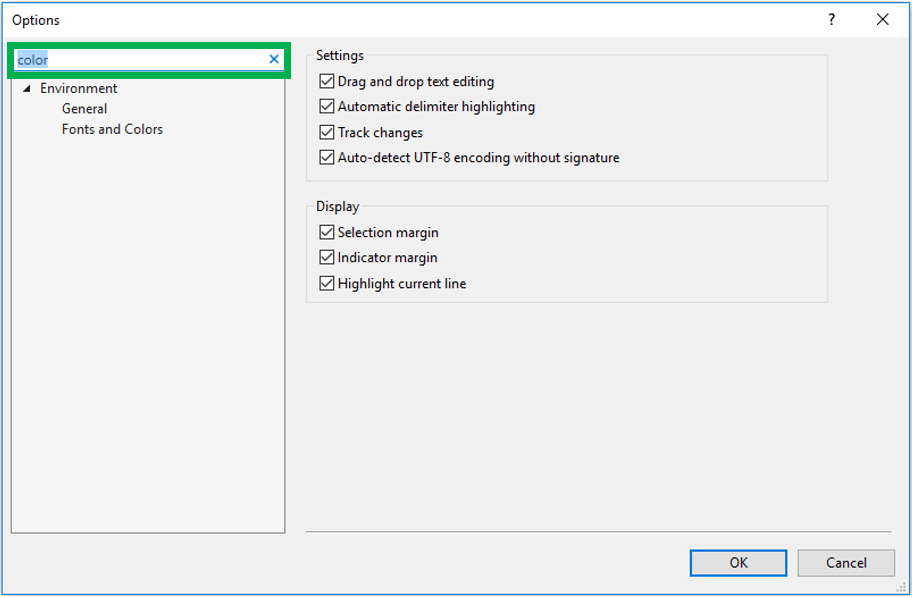


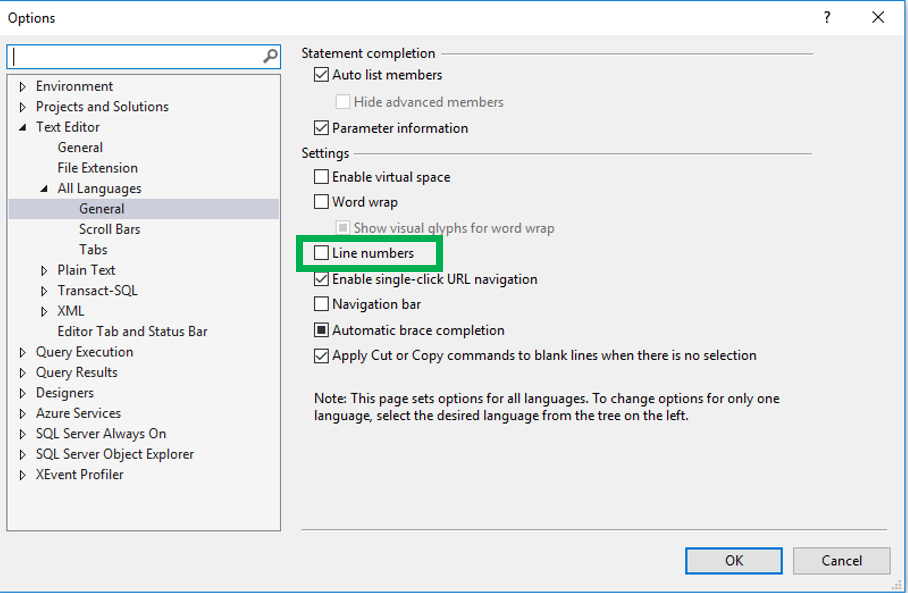
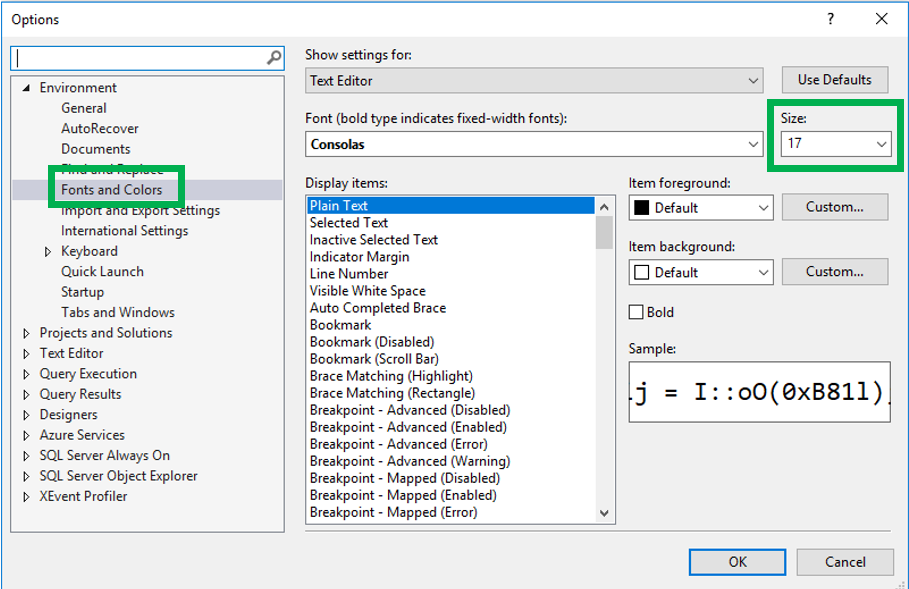
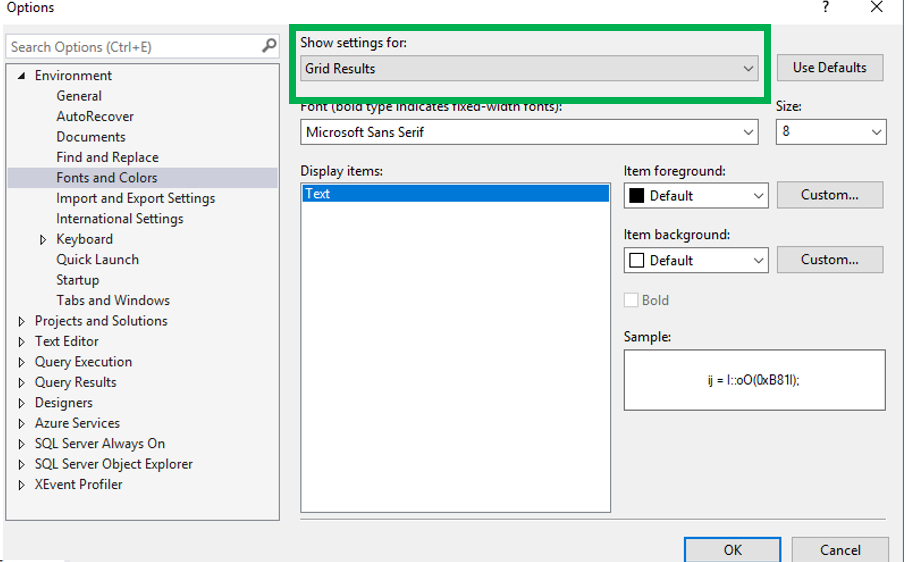
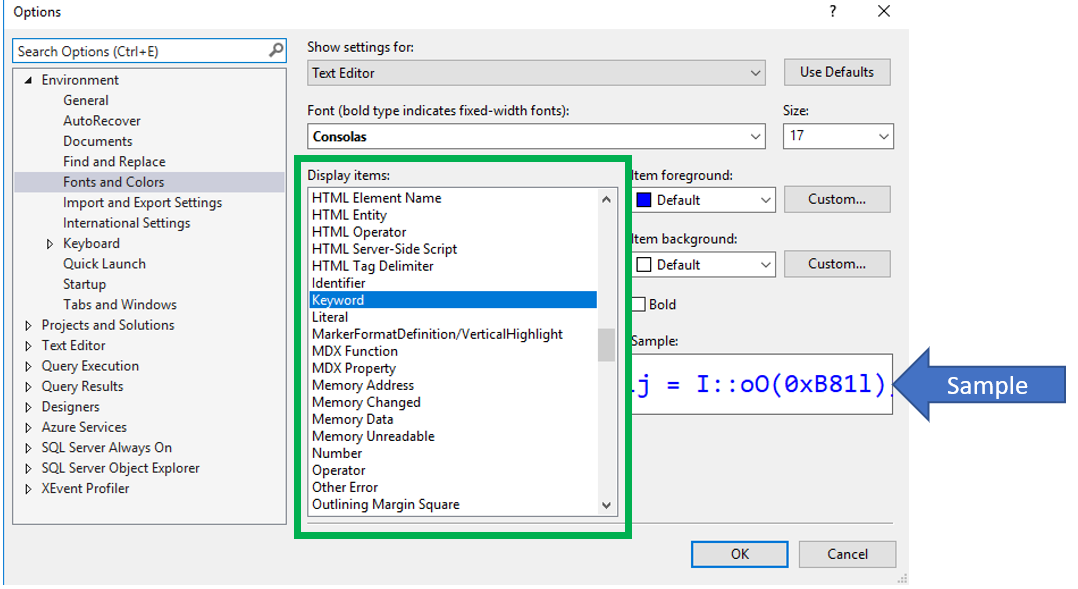
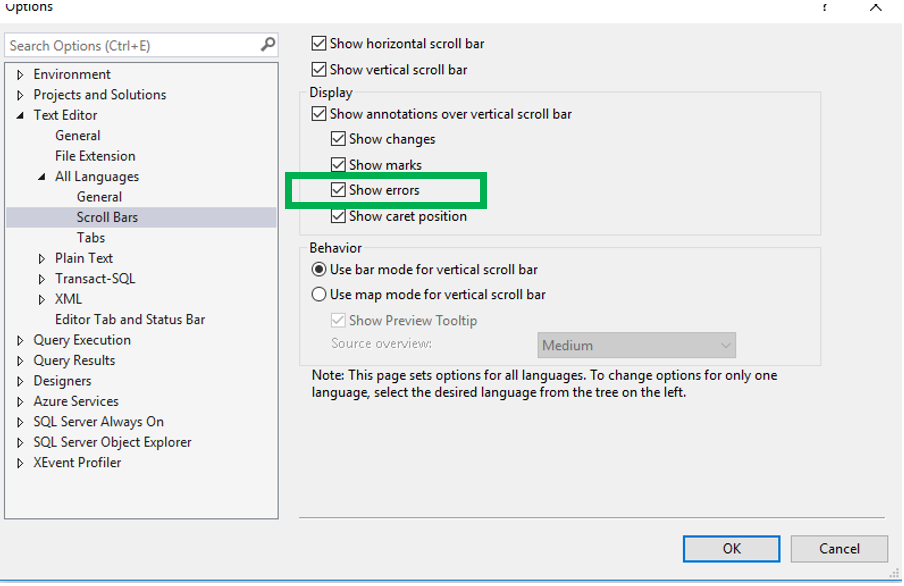
 If you decide you would like to change the colors of fonts, you can do so by selecting the proper word type, inside green box below, and then modifying the settings. This screen also gives you an example of what the text will look like.