Extended Events Max Dispatch Latency

When you create an Extended Event session, there are a number of properties that you can set.  These properties are spread through out the tabs in the Session Properties window.

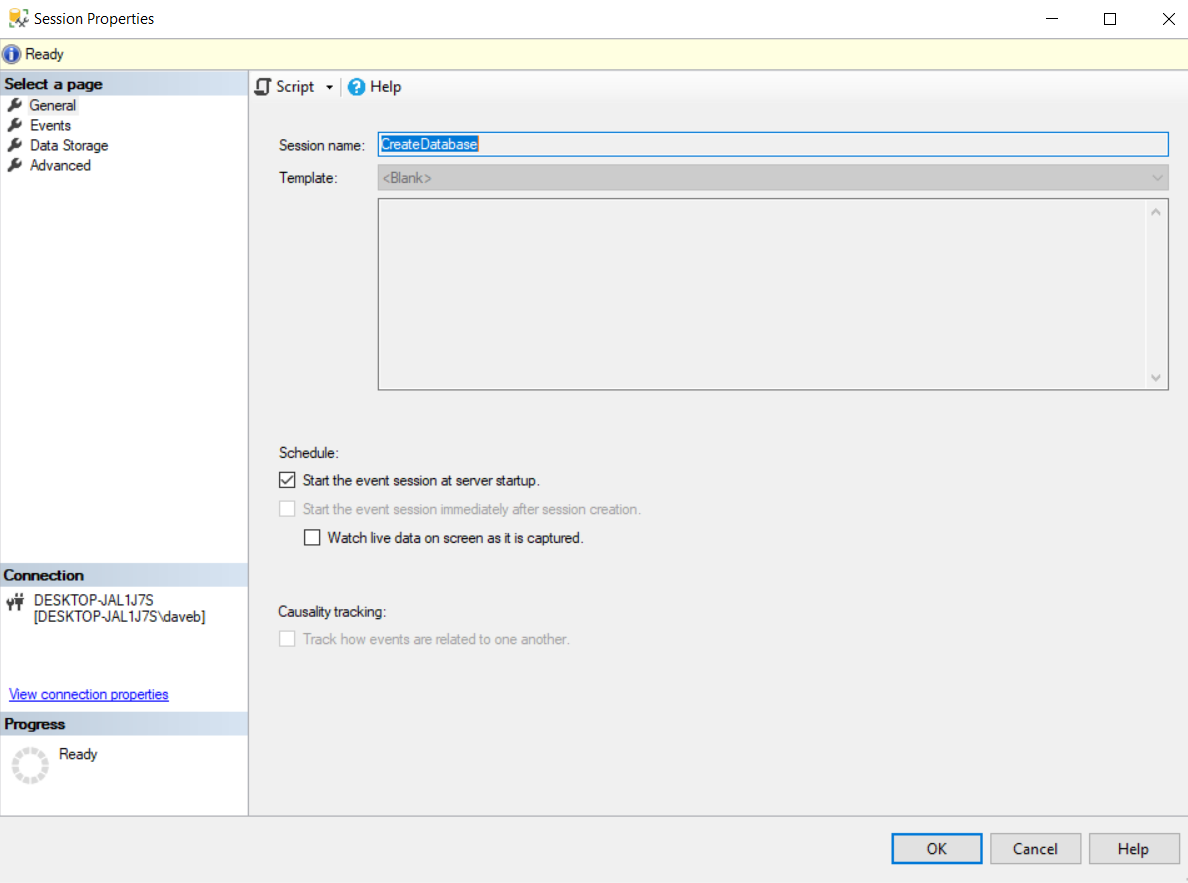
Below you will see the four tabs,  General, Events, Data Storage and Advanced.

Just as a brief summary let’s go over a few of the key properties in each tab.

In the session tab, the obvious properties is the “Session Name”.  But there is also another key property, “Start the event session at server start up”.  This is an important property that can assure the session starts in the event of a server restart.

The event tab is exactly what you think it might be, it is where you will decide what events you want to capture and what data columns you would like to capture.

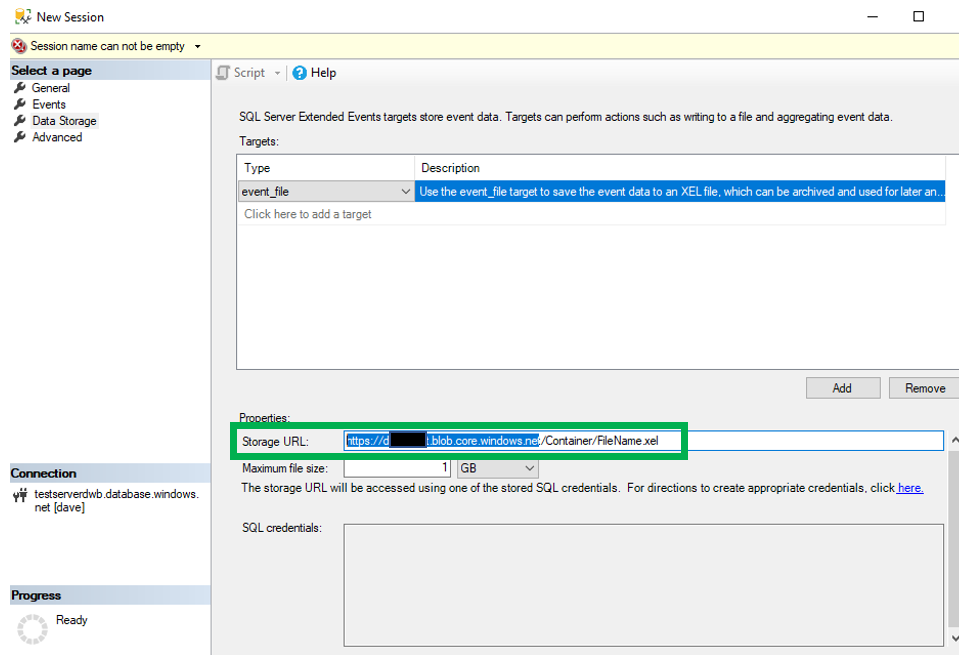
There are a number of options for storage and you will set this in the Data Storage tab.  Where the data collected is stored is referred to as targets  Two of the commonly used targets are ring_buffer, this is memory, and file target.

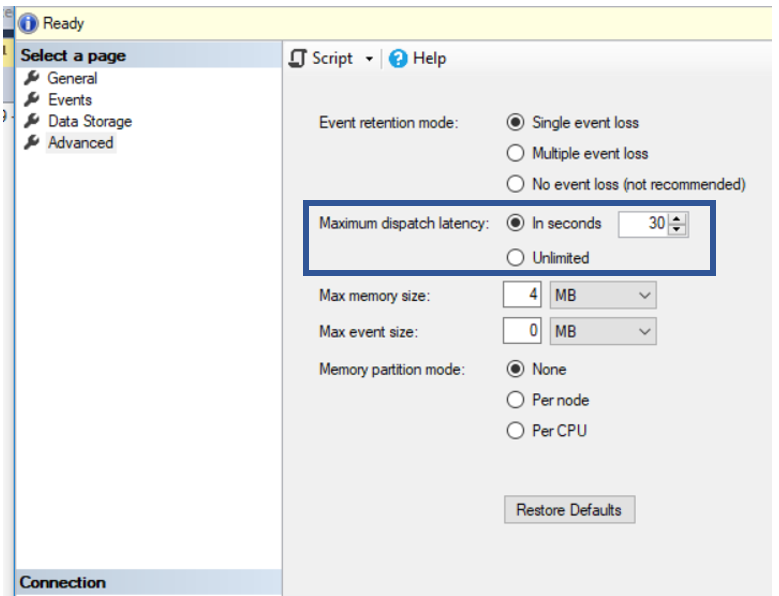
Which brings to the last table, Advanced.  This is where the Max_Dispatch_Latency property can be found.  The max_dispatch_latency property is the maximum duration that an event, once captured, would reside in the buffer before written to the target.  This doesn’t mean it will always take this long, just the maximum amount of time it will take.  The default for this property is 30 seconds.  For the most part, this is a good number and should avoid changing it.

You would logically think that the minimum setting would be zero seconds.  If you think that way, you are correct.  However, 0 does not mean 0 seconds.  When this is set to 0 it means the event will stay in the buffer until the buffer becomes full.  This is the same set setting the “Unlimited” option you see below. Given this, the true minimum is one second.

When I present my Extended Event session I usually use the Create Database event in my demo.  Once, I create the database, I go immediately to the target to see if the event has been written to the target.  Usually that takes just a few seconds.  I only see the event written to the target about 50% of the time.  This is because of the max_dispatch_latency.

Here is a really nice article by Jonathan Kehayias on the properties of an extended event session, click here.

Thanks for visiting my blog and I hope you learned something!

Capture Deadlock Information with Extended Events

Over the past few years, I have presented a number of sessions on Extended Events.  As I prepare to present the topic a few more times in the coming weeks, I thought I would do a blog post on one particular event that has been very helpful to me when working with issues in a production environment.  That event is related to the Deadlock graph.

There are several ways you can capture this.  Profiler has been a very good and very effective way of capturing the Deadlock graph. However, starting with SQL Server 2008, there is now another option, Extended Events.  RedGate also puts out a great tool named SQL Monitor that can be used.

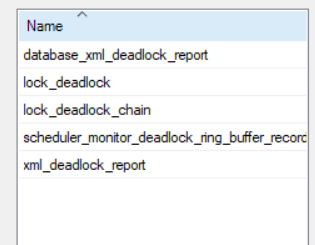
I am not going to get into the ins and outs of Extended Events in the post, I am simply going to cover how to use Extended Events to capture the deadlock graph.  There are a total of five events that have the word “deadlock” in the event name.

Let’s take a moment and quickly go over each of these five events.

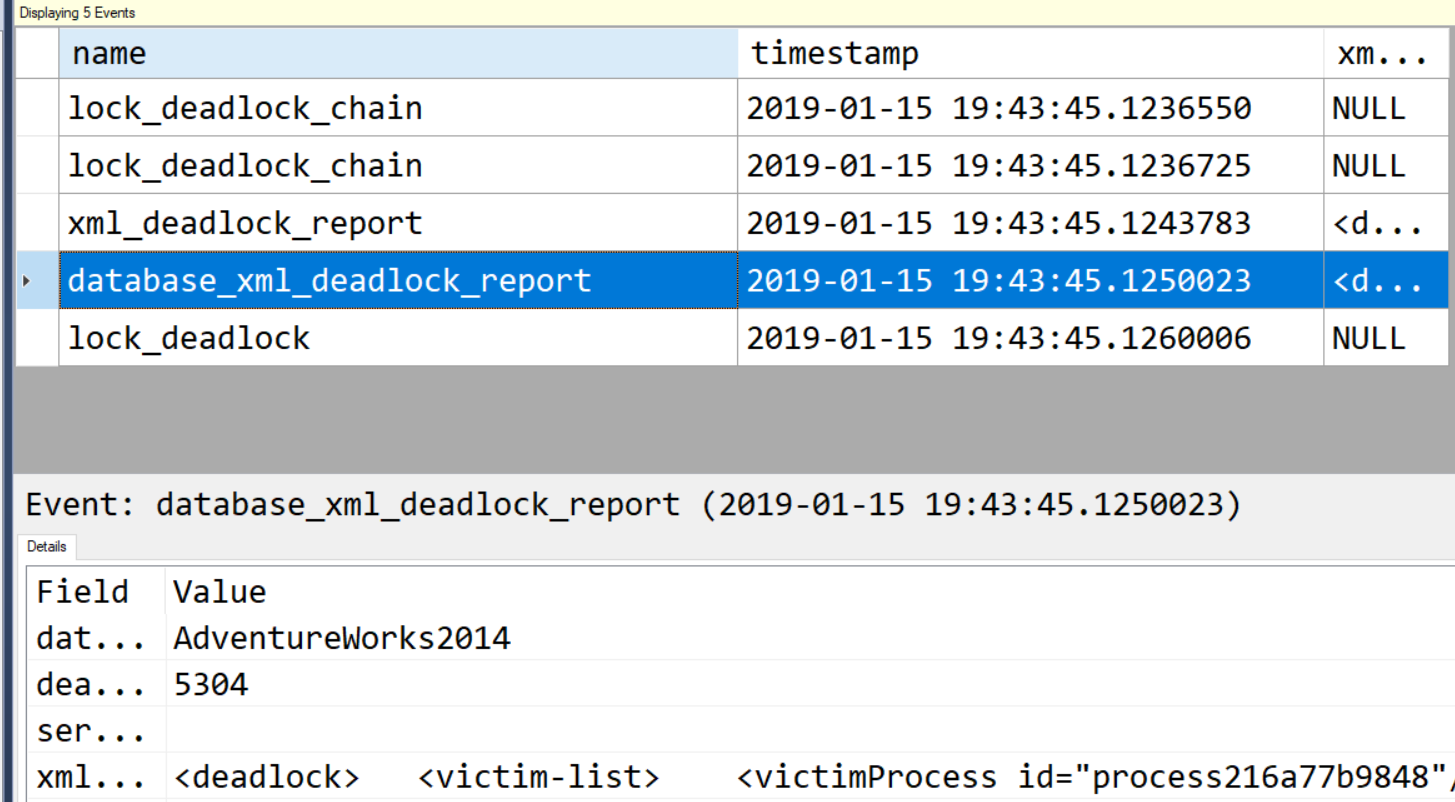
database_xml_deadlock_report – This will be the same as the xml_deadlock_report, with one noticeable exception.  The xml_deadlock_report event has an additional tab, while the database_xml_deadlock_report does not have this.  This tab is where we will find the graph.

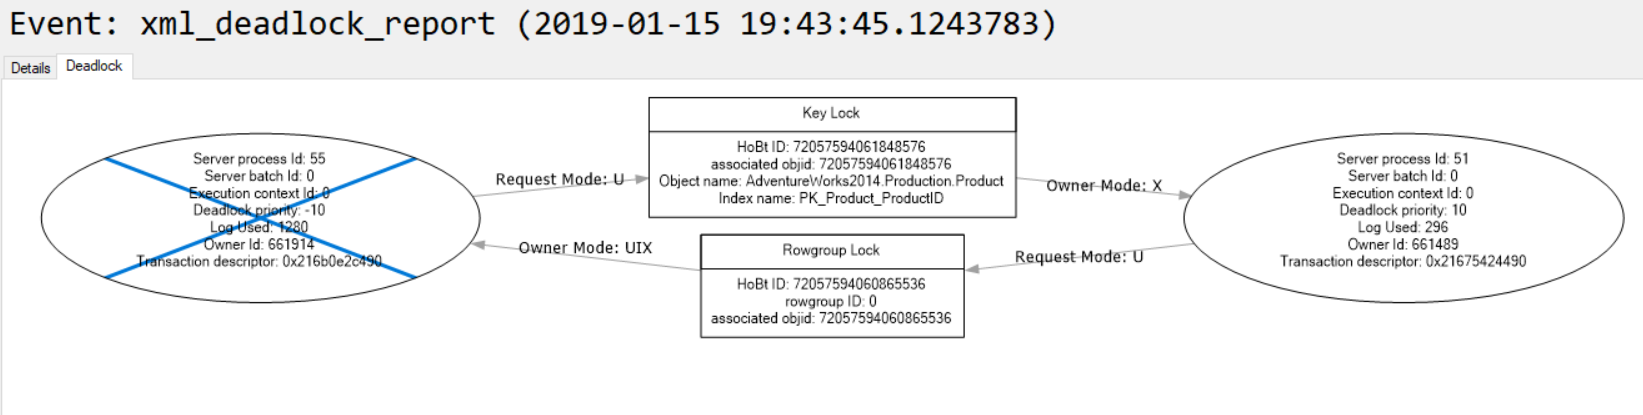
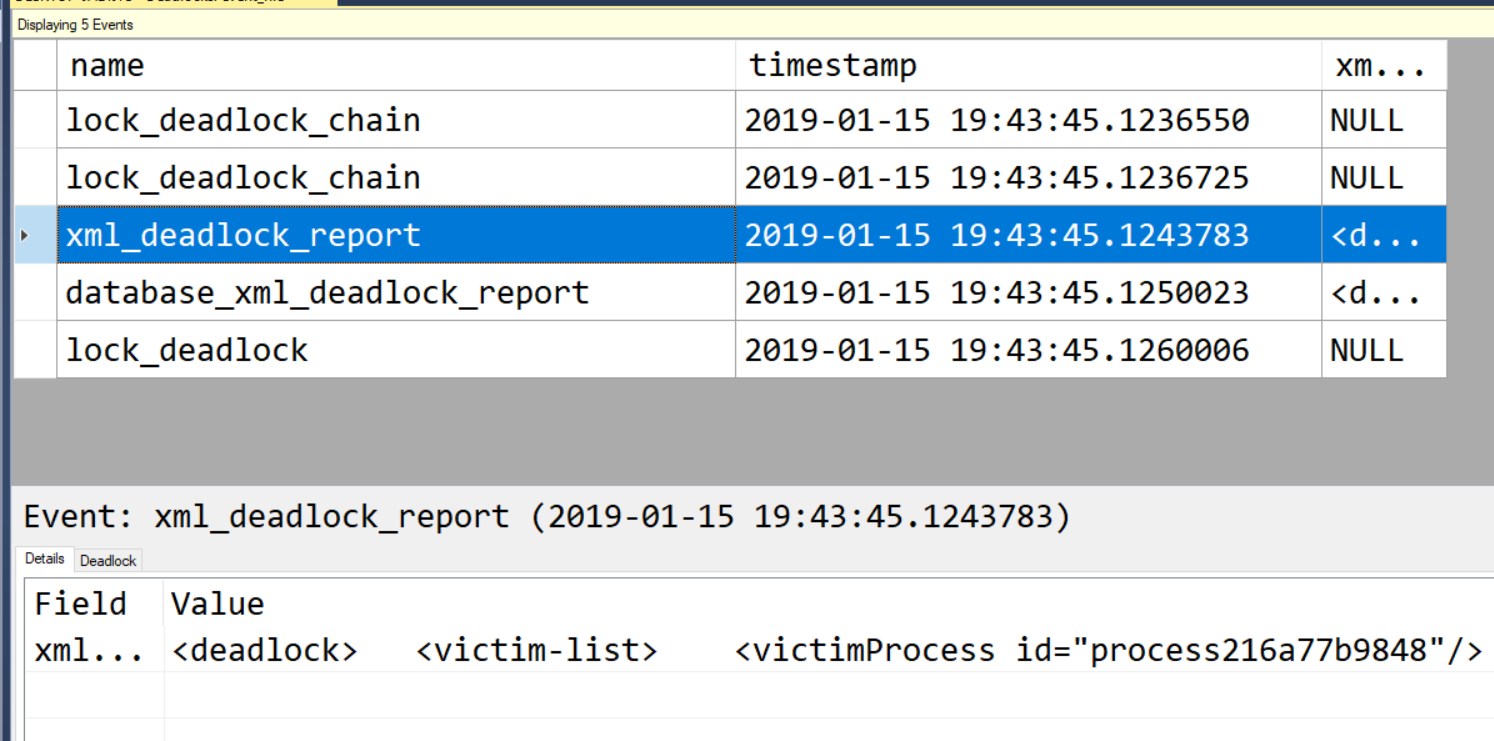
xml_deadlock_report – This is very similar to the database_xml_deadlock_report with the addition of the deadlock graph.  To see the deadlock graph, simply click on the Deadlock tab.

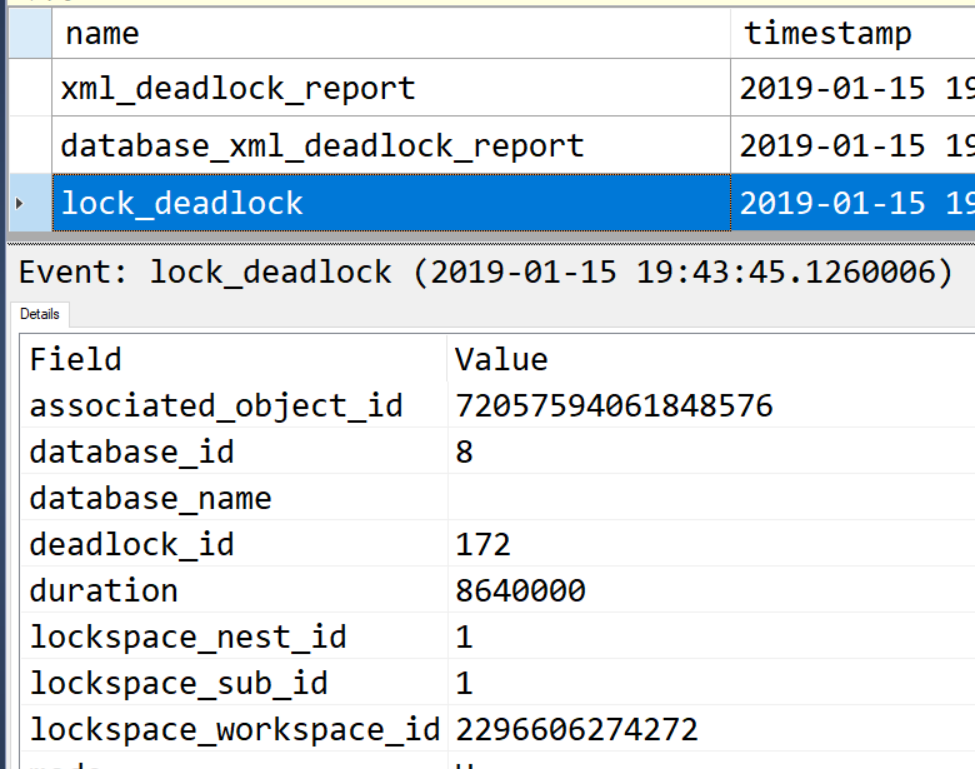
lock_deadlock – “Occurs when an attempt to acquire a lock is canceled for the victim of a deadlock.”  This definition is from the SQL Server Extended Event properties. Of the events we have discussed so far, this event has the most data points.


lock_deadlock_chain – “Occurs when an attempt to acquire a lock generates a deadlock. This event is raised for each participant in the deadlock.” This definition is also from the SQL Server Extended Event properties.

scheduler_monitor_deadlock_ring_buffer_recorded – “The session tracks other useful events which makes it easy to trace back the series of events which led to the deadlocked schedulers condition!” – From www.troubleshootingsql.com

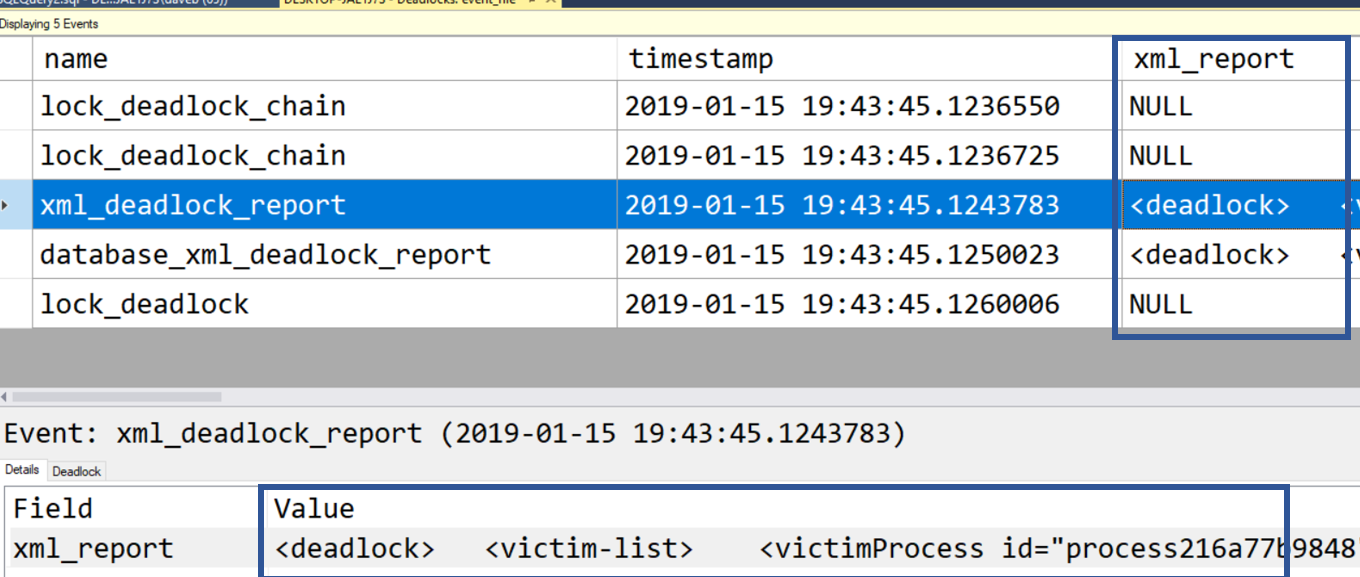
Since this post is about the deadlock graph, we will focus on the xml_deadlock_report event. As mentioned before, this is the event you will need to use if you want to capture the deadlock graph.  There are two points to look at, the column is “XML_report” and the other is the graph itself. In the image below you will see that there are two places to look at the actual XML.  If you do not see this column in the grid, you can right click on it in the details at the bottom and then click “Show column in table”.  It might be very challenging to read due to formatting.  If you are having a difficult time reading the XML, this one of many online formatting tools can be very helpful to get good formatting.

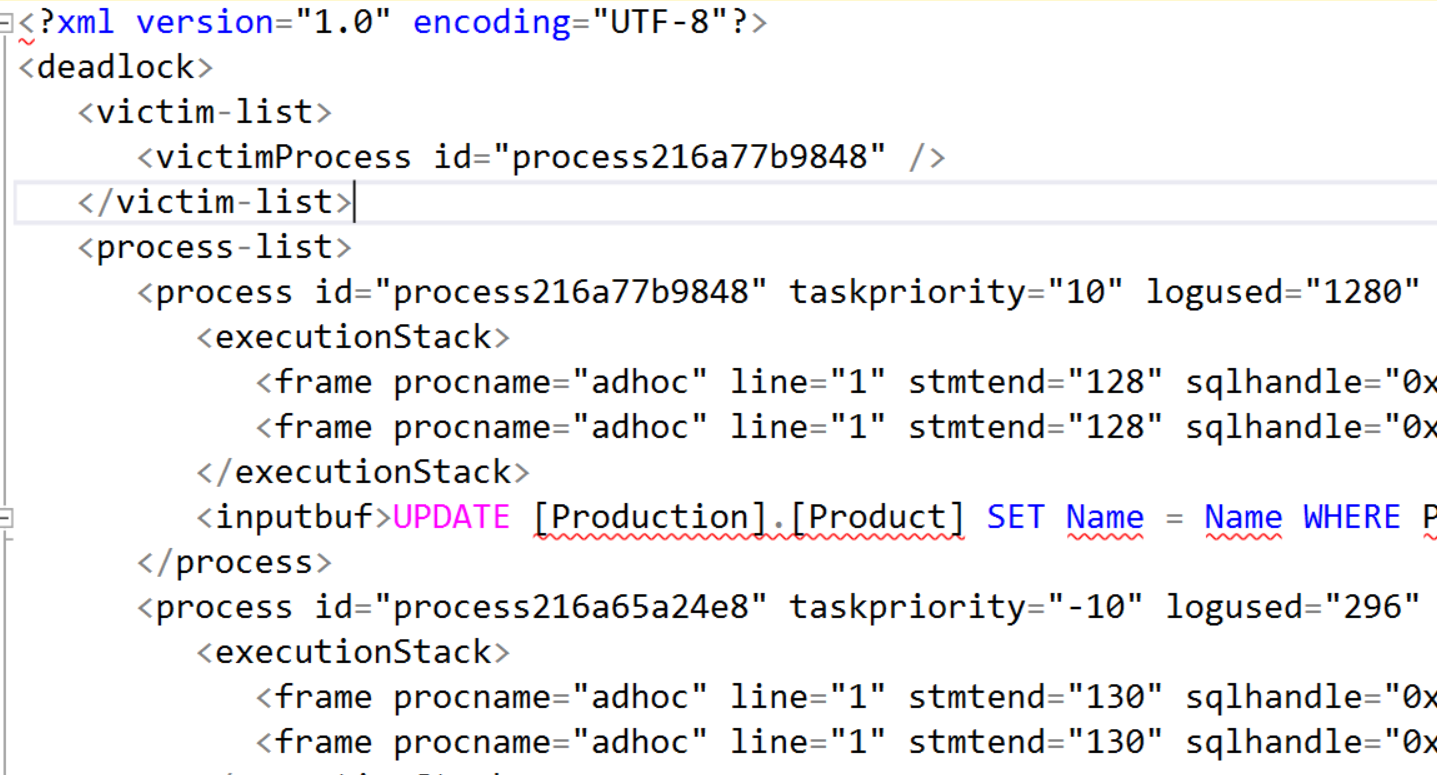
This is the actual XML that is used to build the graph.  This is quite a bit of useful information in the XML.  You can see the victim query as well as many other good data points.  The victim process can be found in the “victim-list” node.  In the image below, you will then see two processes, the first one listed matches the victim process id.  The UPDATE just below it is the T-SQL that was chosen as the victim.


The deadlock graph, while initially looks very useful, it does have a significant limitation.  The query with the blue X on it is the victim.  If you float your cursor above it, the query will then appear in a context pop up.

If you left click and hold one of the shapes you can move it around. This can be useful when there are more shapes than you see above.  Now on to the limitation, you can’t zoom it.  Without this, it can be difficult to see some of the details.

Here are just a few interesting deadlock graphs I have been able to capture.


While these are kind of interesting to look at, the scary part is what caused these.  These were all caused by a single stored procedure.  Now you have the graph.  I think now the fun is just beginning trying to figure out what is causing this and a solution.

If you would like to read more posts about Extended Events, please go to the View All Posts page.

Thank you for stopping by my blog!!!
Events…No Events

Extended Events is a great way to capture information about what is happening on your server.  You can capture information about deadlocks, failed logins, wait stats and many more important performance data points.

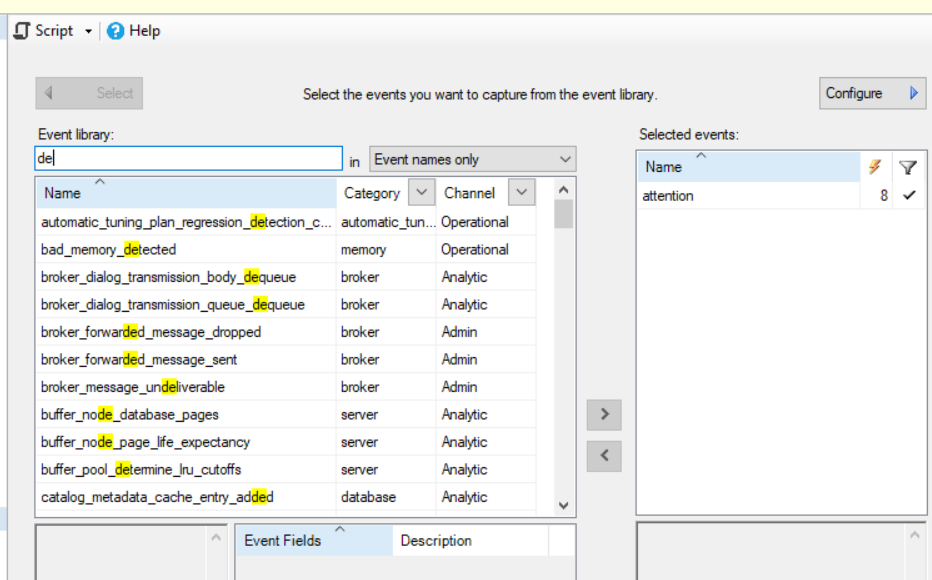
One of the nice features of the Extended Event interface in SQL Server Management Studio is the searching feature that can be used when setting up a session.  In SQL Server 2017 there are over 1,500 events that can be utilized.  Searching through all those events can make it a challenge to find the event you are looking for.

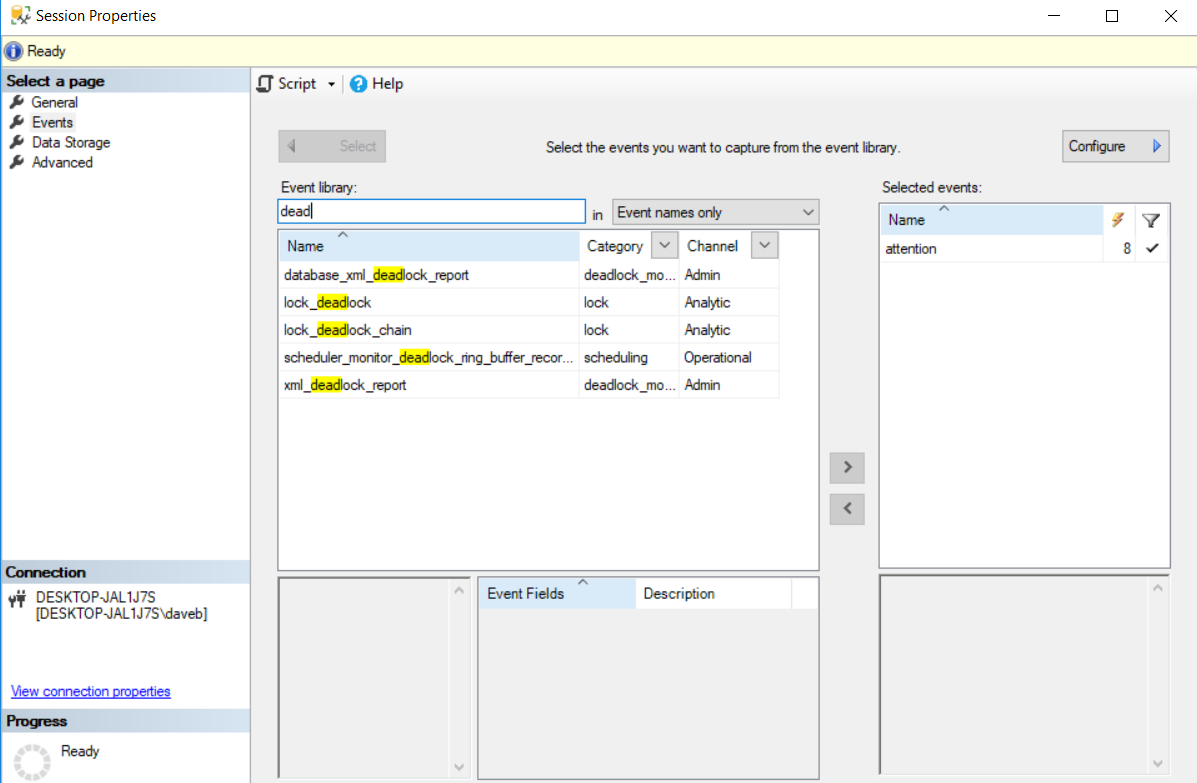
Luckily Microsoft has given us some help.  If you look at the image below, you can see under the “Event Library” box the two letters “de”.  As expected, this returns any event name that has “de” in the name somewhere.  It could be at the beginning, middle or the end of the event name.

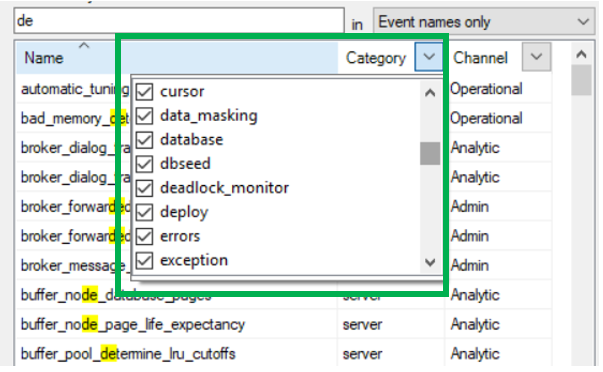
The events returned will be based on two additional things category and channel.  Both of these options help to limit the number of events you will see in your results.

Category is simple groups of events.  For example, in the database category you will find many events related to databases. These include the following:

        • Database Starting
        • Database attached
        • Database created
        • Many..many more

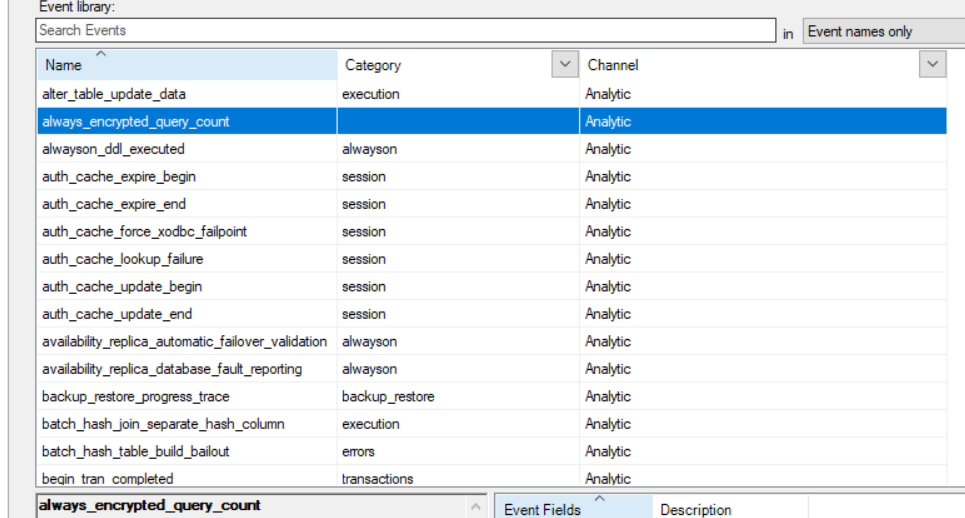
The Channel is also a grouping of events, but this grouping is more on who and or why the events might be used. Below is a sampling of what you will find in the Analytic channel.

I have never really changed either one of these and I have been able to find every event I needed.

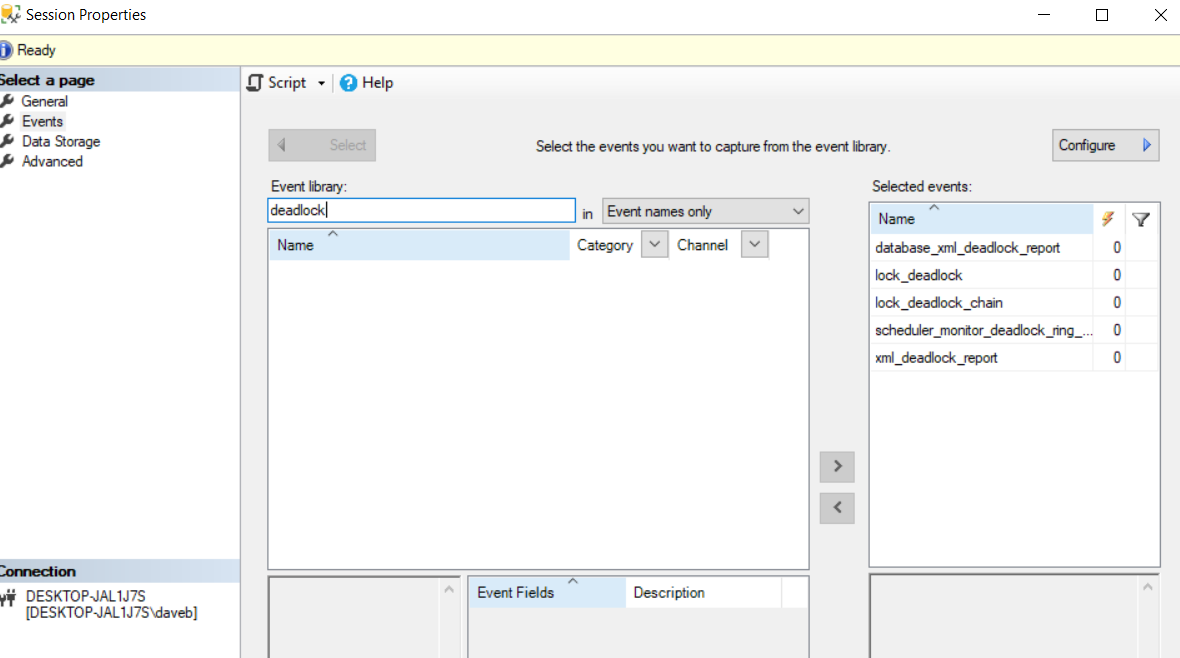
Now, what does it mean when I enter a value, for example “deadlock” into the Event Library search box and I get this:

Notice that no events are showing up.  Well there are a few reasons why this is happening. First thing to check is the Category and Channel to see if you are limiting the results.

Another reason is that all the events that contain that string are already in use.  If you look at the above screenshot, you will see that there are five events related to deadlocks and the are all in the “Selected Events” pane.

Now you can see that all 5 events are now showing up to select from.  This is a very short blog, but hopefully you learned something.

Thanks for stopping by my blog!!!

Azure SQL DB and @@version

Many of us are used to using @@version to get the version of SQL Server we are using.  This also works when you are utilizing an Azure SQL database, although the results are slightly different. However, before getting to @@version, I would like to go over a few other methods to obtain version information.

How to Get Version

There are many reasons why it is important to know the version of a SQL Server.  The reasons include everything from licensing to upgrades.  In this section, I will cover a few of the common methods used to get the version of SQL Server.

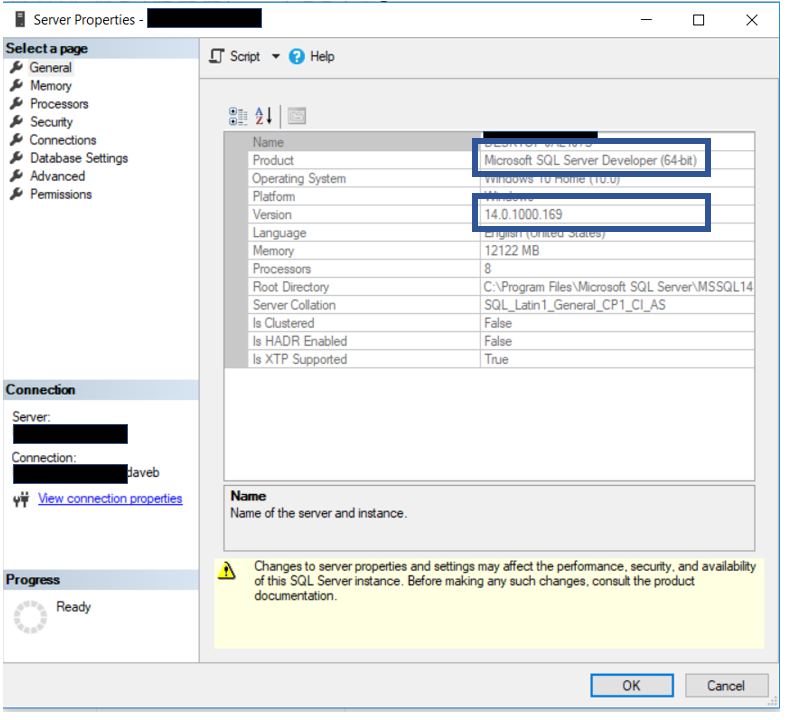
With an on-prem instance of SQL Server one method that can be used to get the version is to right click on the server in SQL Server Management Studio.  Once you do, you can click on the properties menu item and the window below will appear.  As you can see, in the boxes you are able to see both the version and edition of the SQL Server.

However, when you attempt to do this in an instance of Azure SQL database, the properties menu item is not available.  Below is what you will see when you right click on the instance of an Azure SQL database in SQL Server Management Studio.

Another method to get the version of SQL Server is to utilize the SERVERPROPERTY function.  The SERVERPROPERTY function can be used to view server level properties, in this case the product version.

SELECT SERVERPROPERTY(‘ProductVersion’);

When you execute the above statement you will then see the version. It will look like the number below.  The number represents the version, in this case, SQL Server 2017.

14.0.1000.169

As mentioned above, the ServerProperty function can be used to return a number of bits of information about the server.  Here is a link for more detailed information, click here.

The final method I would like to talk about is using @@version.  This is a global variable in SQL Server that will return not only the version of SQL Server, but also the OS version.

When reading from this global variable, you include it in a SELECT statement as illustrated below.

SELECT @@Version

The results will vary from an on-prem instance of SQL Server to an Azure SQL Database.

This is what you will see for an on-prem instance.

Here is the complete text of the results.

“Microsoft SQL Server 2017 (RTM) – 14.0.1000.169 (X64) Aug 22 2017 17:04:49 Copyright (C) 2017 Microsoft Corporation Developer Edition (64-bit) on Windows 10 Home 10.0 <X64> (Build 17134: ) “

As you can see it returns some good information.  Including the version of SQL Server, the service pack status, 32-bit or 64-bit and the OS version.

However, the results change quite a bit when this is ran against and Azure SQL database.

The complete text is just as you see it above.  Notice the lack of OS version.
What is next?

Now that we have covered a number of ways to get the version information, let’s take a look at some of the differences from an on-prem instance to an Azure SQL database.

When looking at the results, it is easy to identify an instance as an Azure instance in just in the first few words, it clearly states that it is an Azure instance, it is indeed in Azure.

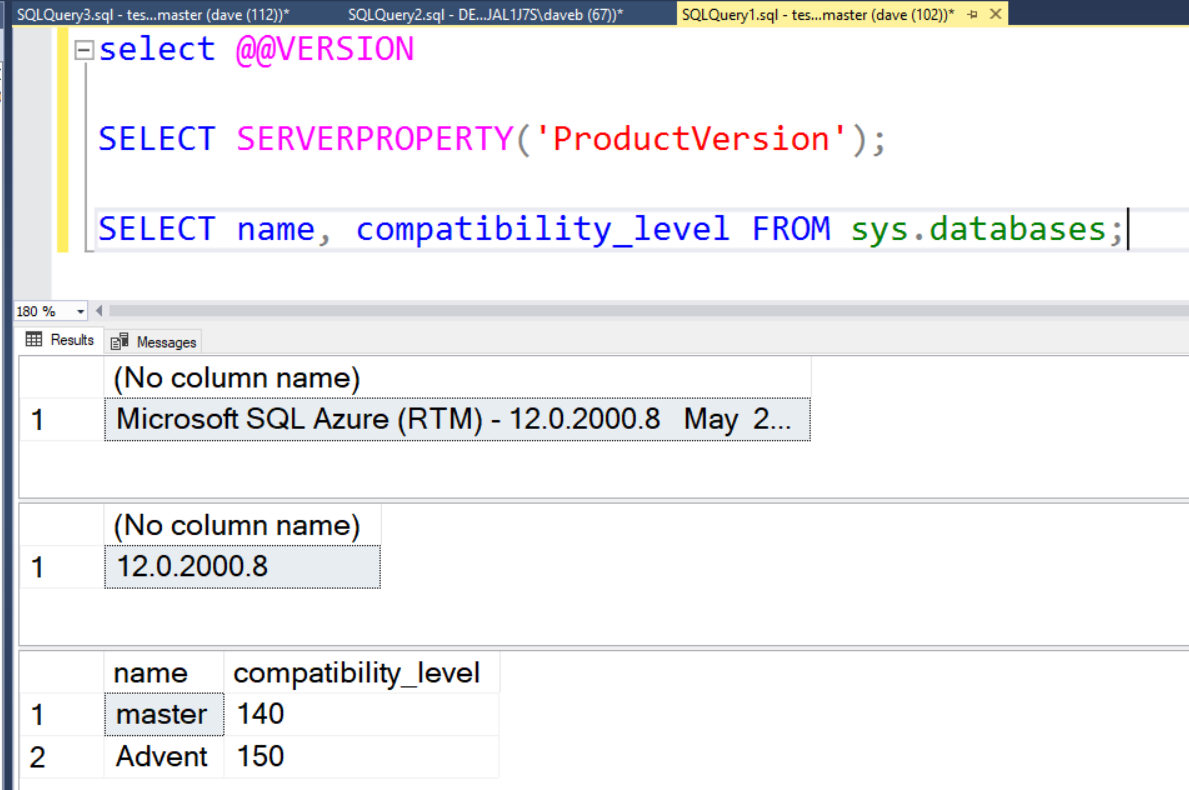
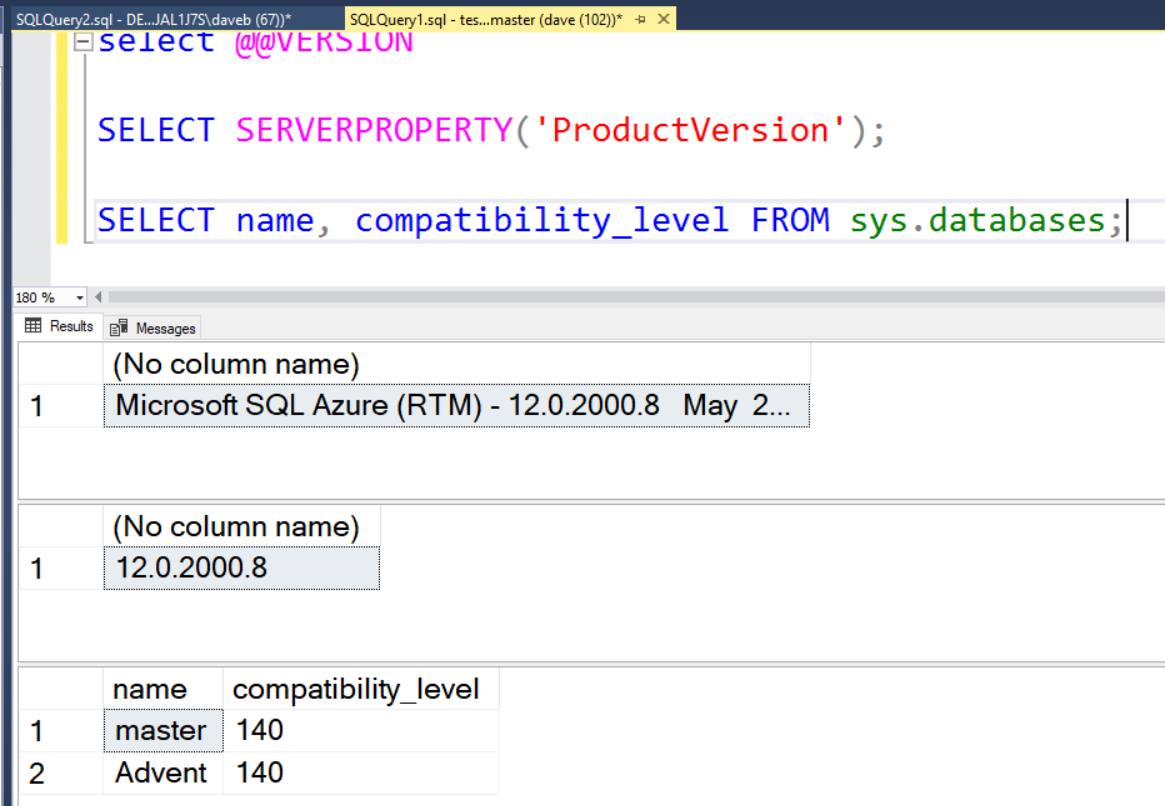
If you look at the results below you will see that I used both @@version and ServerProperty to get the information I am looking for.  You will also notice that I included a simple query using the sys.databases object. This will return the compatibility level for each database, which as you will see is going to be important.

Looking above you will see that it is an Azure instance, has a product version of 12.0.2000.8 and both databases have a compatibility level of 140. The compatibility level of 140 is SQL Server 2017.

What….12.0?  Isn’t that SQL Server 2014?  If you said yes, you are correct. Is it really possible that Azure SQL Database is SQL Server 2014? The answer is no.  That number is different that an on-prem instance of SQL Server.  According to what I have ready, version 12.0 is the most current version. Given both the Azure instance and the SQL Server 2014 both of a product version of 12.0, it now comes down to the compatibility level for the databases for Azure.

As you can see both databases of a compatibility level of 140, which is SQL Server 2017, not 2014. Since I didn’t change this when I created the databases, this tells me that the instance of Azure SQL Database was on SQL Server 2017 when I created the database.  As with an on-prem instance of SQL Server, the compatibility level for an Azure SQL database can be changed. When I created a new Azure SQL Database, the compatibility level was 140, which is SQL Server 2017.

To change the compatibility level of a database you have to run an Alter Database command.

ALTER DATABASE Advent
SET COMPATIBILITY_LEVEL = 160

When I ran the above code, I got an error.

Msg 15048, Level 16, State 1, Line 1
Valid values of the database compatibility level are 100, 110, 120, 130, 140 or 150.

Notice it states that 150 is an option, while 160 is not.  Compatibility level of 150 is SQL Server 2019, the latest version.  It looks like the available options go back quite a bit, version 100, which is SQL Server 2008.

Since in Azure SQL Database, the version of the database is key when investigating versions, below you will find the code to retrieve the versions of all databases.

SELECT name, compatibility_level FROM sys.databases;

All the above code, works on both an Azure SQL database and an on-prem SQL Server.

Notice that the Advent database has a compatibility level of 150, SQL Server 2019.  When investigating version information, it important to also review the compatibility level of the database you are looking at as well as the server version.

Thanks for stopping by, I hope you learned something.

Azure Metrics Reporting

A few days ago, I did a post on DTUs of an Azure SQL Database.  In the post, I mentioned a report that you can use to see how many DTUs your subscription has used.  This is an important number to know and measure over time so you don’t get slapped with an unexpectedly high bill or have performance issues because you have exceeded your DTU limit.

Azure has quiet a bit of reporting that can me used to get the current state of your Azure subscription. Although many of the metrics are targeted more for subscription rather than database performance counters, there are few DB related such as Deadlocks. Below is a small list of the items that can be viewed, of course there are more than included in the list:

      • Azure SQL Database
        • Data space allocated
        • Data space used
        • Deadlocks
        • In-Memory OTLP usage
        • DTU used
          • What is a DTU?  Stands for Database Transaction Unit. Here is a nice article by Andy Mallon the does a nice job explaining what it is. Click Here
      • Storage Accounts
        • Used Capacity
        • Egress
        • Ingress
        • Availability

How do I Get to the reporting tool?

Getting to the reporting tool is just a matter completing a few clicks. Of course with most products there are several ways to get to a specific place.

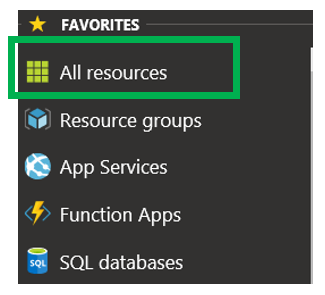
On the left side of the Azure Portal, click “All Resources”.  You could also click on Resource Groups if you like.

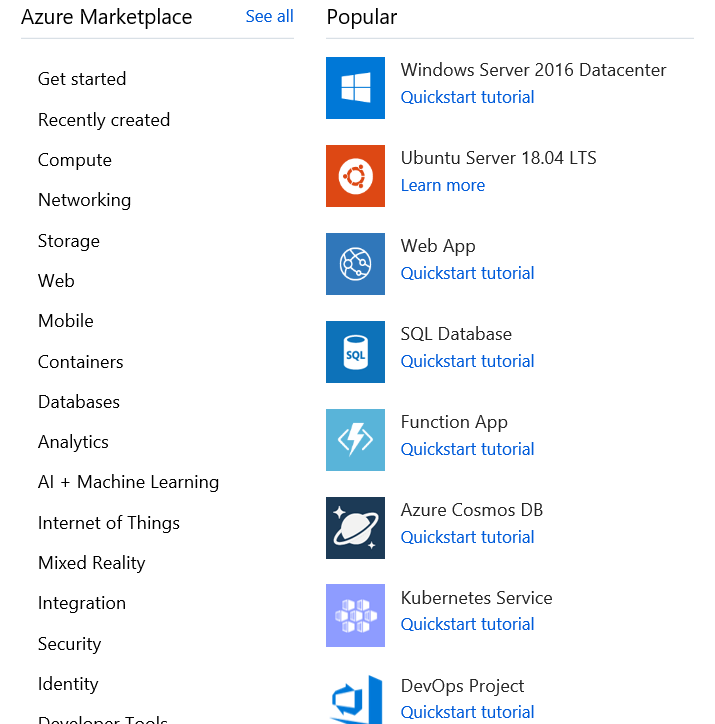
Just a little side note on how to add a resource. As expected there are many resources in the Azure world.  Here are just a few: Azure SQL Database, Azure VM, Storage accounts, resource groups, Cosmos DB as well as many other items.  Not all resources are from Microsoft.  There are a number of resources that are made available in Azure.  After you click the “Add” button, you will be taken to a page that looks something similar to what is below.

Above is a screenshot of some of the available resources.  The list on the left is just the list of resource categories.  On the right are some of the resources in the chosen category.  You can either pick a category or click the “See All” link towards the top.

Once you click the “All Resources” link you will be taken to something that looks like this.

The above image lists a number of important items.  Obviously the resource name is included and the Resource Group that resource is part of.  You can also see the resource type and the Location.  The location is really important, especially when it comes to cost.  Since this blog post is about Metrics reporting, it is important to note that not all the resource types have this type of reporting.  Above you will see that I have three resources, a storage account, a SQL Sever and an Azure SQL database.  Of these three, the SQL Server is the only one that doesn’t have this metrics reporting functionality.

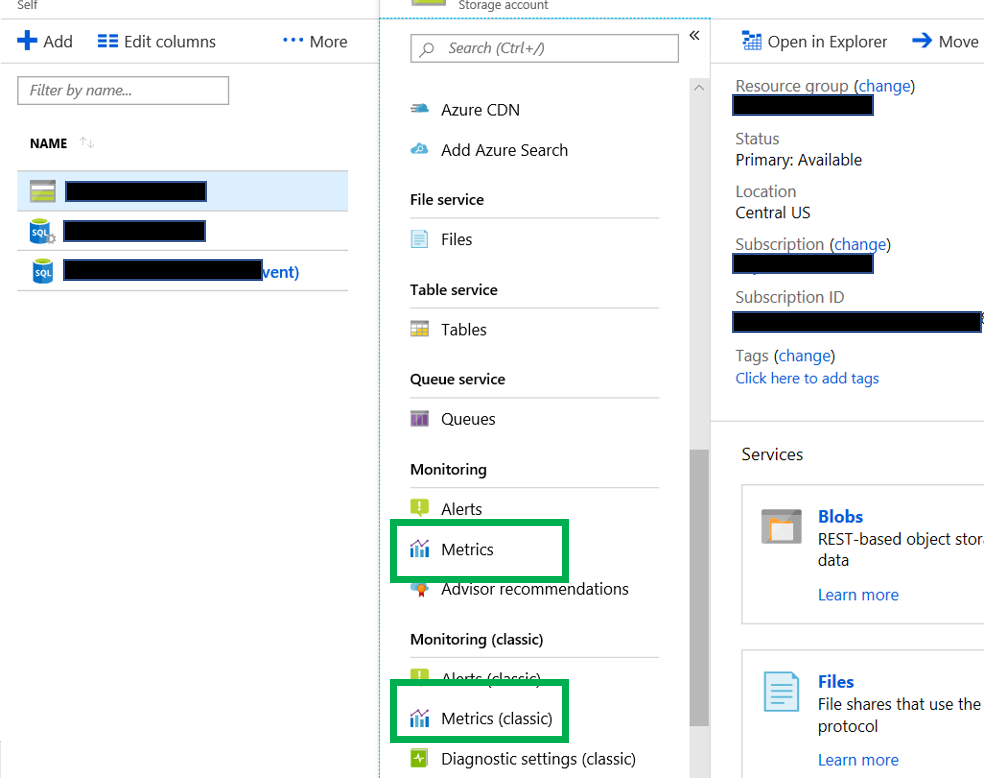
Once you click the resource you would like to get the reports for, you will be taken to a page similar to this.

By chosing a resource on the left, the panel on the right will update with the information for that resource.  In the above situation, I chose the storage account.  Notice two green boxes, both of these will take you to a reporting tool. You want to click the one on the top. The bottom one, Metrics(Classic) is going to be retired on June 30, 2019.  This is according to Microsoft.

Creating the Chart

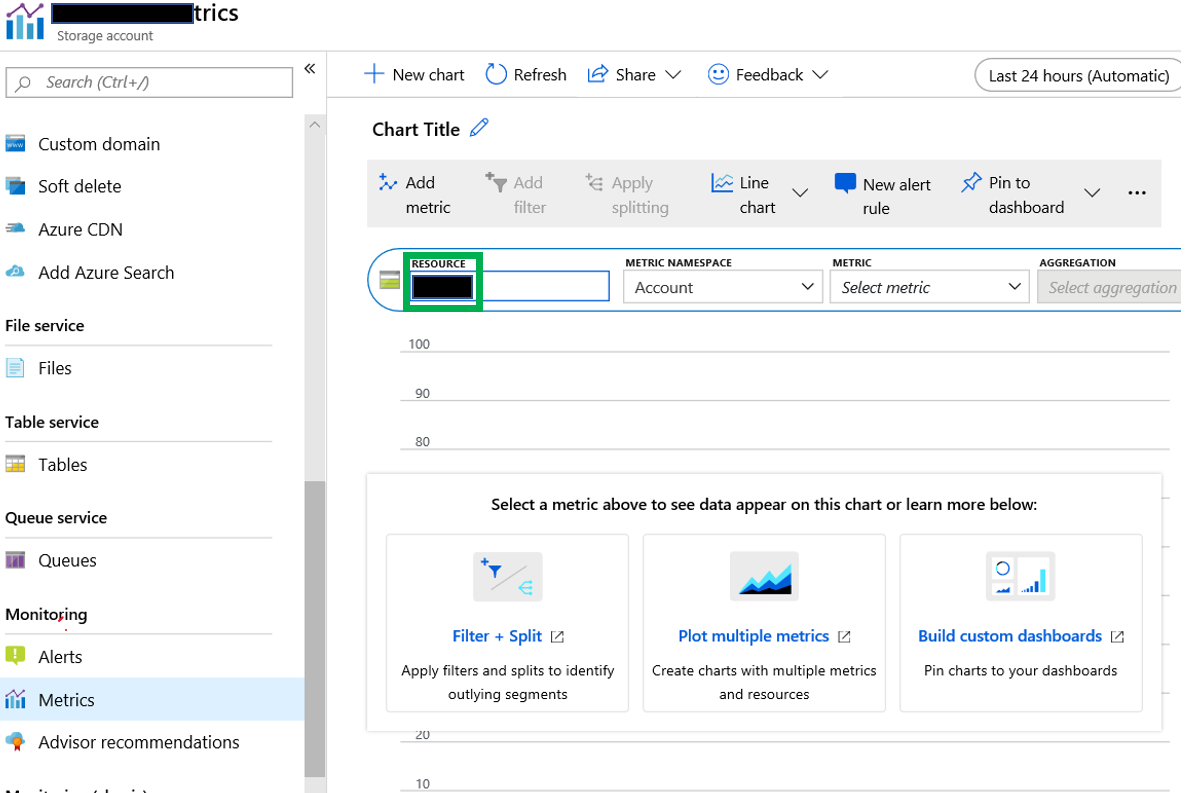
Now you simple click on the Metrics link and you will be taken to a page that looks similar to what is below.

Now confirm that you are on the proper resource by viewing the resource identified in the box highlighted in the green box.  If you are not on the proper resource, simply click the resource that is there and you will have the option to change to the proper resource.

Staying in the same box as the resource, you will see a few other items.

Metric Namespace:  This is the group of metrics that you are looking for.  The items in the drop down box changes depending on the type of resource selected. Since I am working with a storage account, you see the account option.  If you don’t see this for some reason, click the “Add Metric” link that can be found just under the Chart Tile.

Metric: This is the counter that we are looking to review.

Aggregation:  This is what it says it is.  There are usually three options, Avg, Min and Max.  However, some only have Avg as the only choice.

Once you have chosen all the desired options, you will see this.

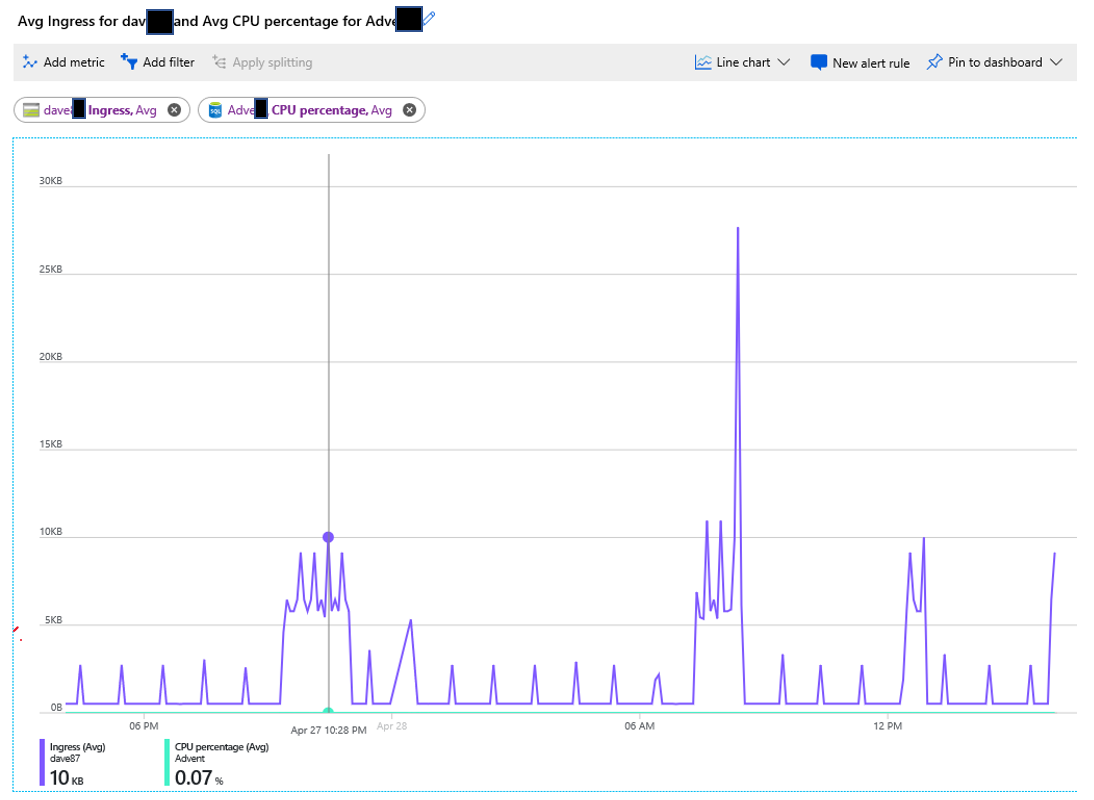
As you can see, this chart contains more than one metric.  This is easy to add, just click the “Add Metric” link in the upper left hand corner. When you do, you will be given the same options as before.  The additional metrics do not have to be from the same resource, as you can see.  The metric on the left is from the storage account, while the one on the right is from the Azure SQL Database.

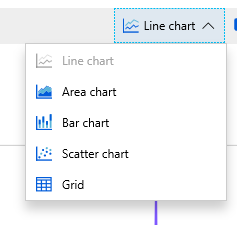
Although this example is a line chart, you can change the chart type easily.  Just click the arrow to the right of where it says “Line chart” in the upper right corner.Just like in Excel, there are a number of options for chart types, just not as many options.  Only 5 options here.  Just like in any other reporting tool, not all charts work well with all data sets.
Also in the upper right corner you can change to time range of the chart.

If you click the time, the options window for the chart will open up. As you can see there are a number of options, including the time range, the Time granularity(time interval) and the time(GMT or local time).
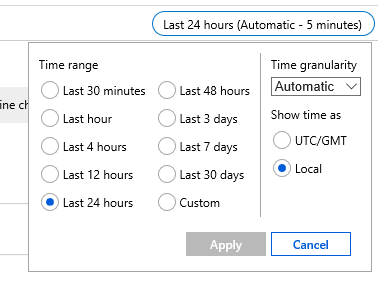
The options for Time granularity are in intervals that would be expected.  The options are listed below.

      • 1 minute
      • 5 minute
      • 15 minutes
      • 30 minutes
      • 1 hour
      • 6 hours
      • 12 hours
      • 1 day
      • 1 week
      • 1 month

You also have another option, Automatic.  The interval for automatic is dependent on the Time Range chosen. Below are the time ranges with the automatic interval.

      • Last 30 min – 1 minute
      • Last hour – 1 minute
      • Last 4 hours – 1 minute
      • Last 12 hours – 5 minutes
      • Last 24 hours – 5 minutes
      • Last 48 hours – 15 minutes
      • Last 3 days – 15 minutes
      • Last 7 days – 15 minutes
      • Last 30 days – 30 minutes

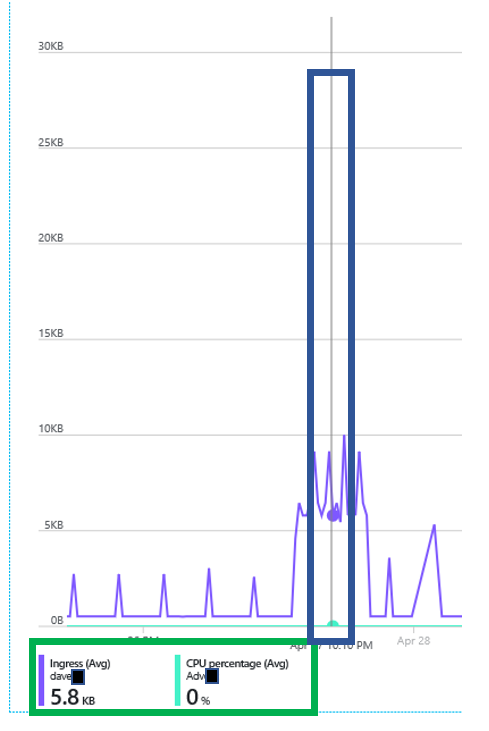
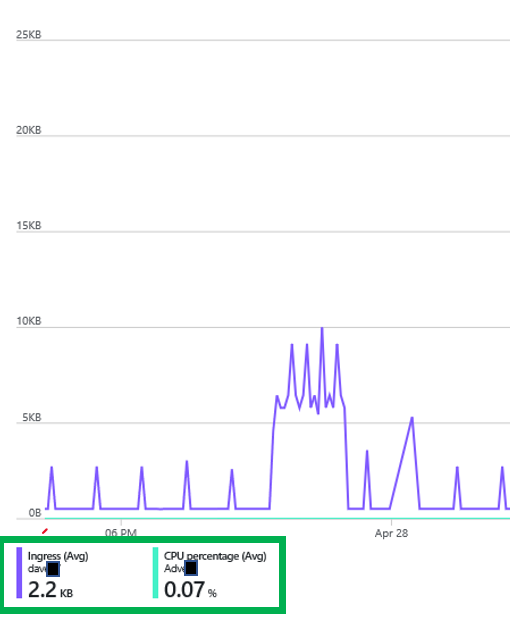
Another area that could be very helpful is in the lower left corner.  There will be one number for each metric that has been added to the chart.

In the green box above there are a number of data points.  It contains the resource name of the color of the line in the chart.  It also contains the name of the metric, aggregation used as well at the value.  In this case the number represents the aggregation listed for the data range of the chart.  If you float your cursor over the chart and vertical line like below will appear.  When you do this, you can move it to any time on the chart and the numbers in the lower left corner will no longer represent an aggregate, but the numbers of the point in time on the chart.

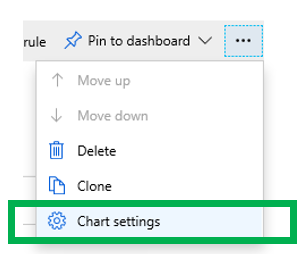
Now that I have created my chart, but the numbers on the Y axis don’t meet my needs.  This can easily be changed.  In the upper right hand corner you will see three dots.  If you click it a menu opens up and you can the click “Chart settings”.

Once you click the menu item, the settings window opens.  Here you can change only Y value.  Remember the X values are determined by the date range mentioned earlier.
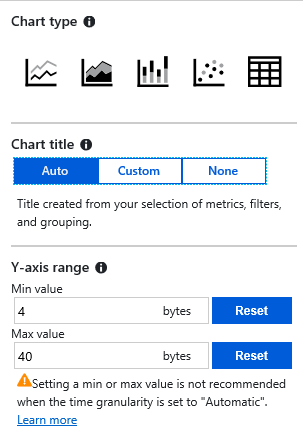
In addition to the Y value, you can also change the Chart Title and chart type.  Notice that the unit of measure is bytes, but many of the metrics are in MB.  If you change to a time granularity to something other than automatic, the warning goes away.

Notice the warning:

“Setting a min or max value is not recommended when the time granularity is set to Automatic”

Pin to Dashboard

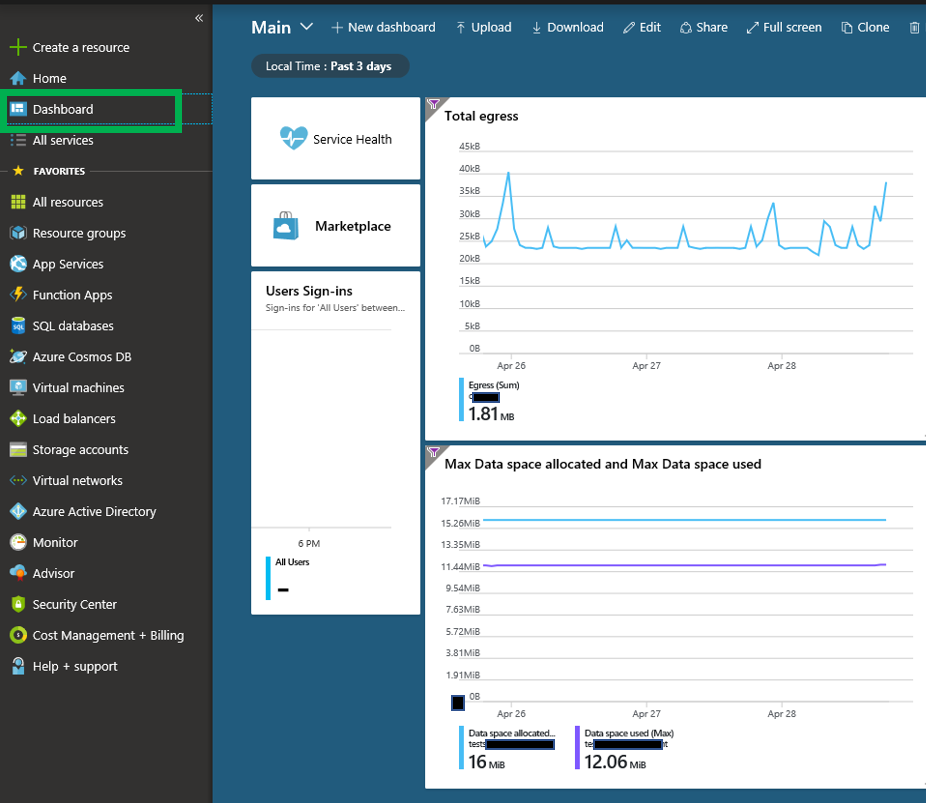
Once you are in the Azure portal, you can have one or more dashboards.  Once  you have your chart looking they way you want it to look, you can then pin it to your dashboard.  Once you do that it, will now appear as below.  In this case I have two charts pinned.


To pin your chart to the current dashboard, click the “Pin to dashboard” button in the upper right corner.

When you do, you will have an option to pin to current dashboard.  However, when it is pinned, your dashboard may not look as you like it.  If this is the case, you can click the “Edit” option on the dashboard.

Once in edit mode, you can move the charts as you see fit.

One nice feature of pinned charts is that the vertical line that appears when you float your cursor over the chart still works.  There is one additional feature that is very nice if you have more than one chart.


When you have more than one chart, the line appears on all charts that are pinned to your dashboard.

Hopefully this will help you with creating charts in the Azure portal.  Thanks for stopping by my blog and I hope you learned something.


Azure SQL Database and DTU

As you know, when you are using an Azure SQL Database you can use SQL Server Management Studio on your computer to execute queries.  You also have an option to use the Azure Query Editor. Here is my post on the query editor.

As I was writing the post I wondered more and more about whether or not there might be a difference in how data usage is billed.  My thought was that since I am going from an Azure SQL database source to another Azure tool, Query Editor, could this potentially reduce my costs.

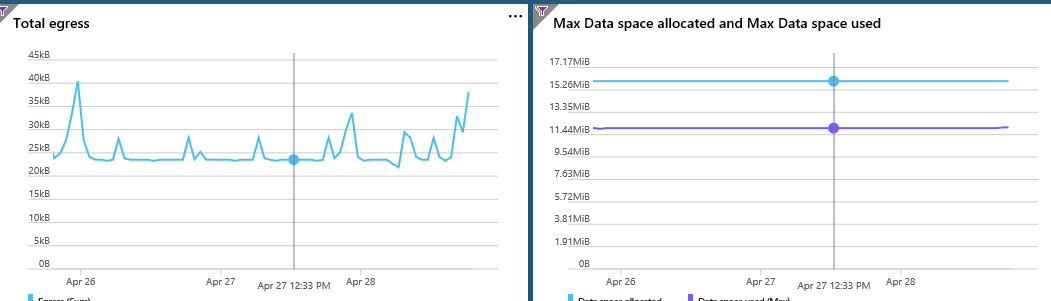
There are a number of Azure resources that have Egress as a metric that can be used to measure the amount of data that is being pulled from the Azure data center.  These resources include the Azure Storage Account. However, an Azure SQL Database does not need to use a storage account.

Before we move on, let’s define what egress is.

Here is a definition of Egress from Microsoft:

“….data going out of Azure data centers” – Microsoft

I think the most important point the two definitions are trying to make is that egress is data going out of a data center, including if it is going from a data center in one region to a data center in another region.  According to Microsoft, if there is a data pull and the database and the querying tool are both in the same region, you will not be billed.  However, you will need to confirm this.

I am not planning on getting into the pricing models for Azure in this post, however you can get that from Microsoft.  https://azure.microsoft.com

Although some resources have Egress to measure data, an Azure SQL Database does not.  It does however have another option, DTU.  DTU stands for Database Transaction Unit and it is a unit of measure that is used, in part, to calculate your bill and to help you chose the proper pricing tier for your database.

A DTU is a “blended measure of CPU, memory, and data I/O and transaction log I/O”, per Microsoft.  The DTU is a measurement for the Azure SQL database only, not for your entire Azure environment or any other database.  An important thing to keep in mind is that when your workload exceeds the DTU maximum for your pricing tier, Azure will then throttle your workload.  My subscription currently has a max DTU of 10. As long as my workload stays below that I should be fine.  Because of the potential of being throttled, it is important to monitor your work load.   This is a nice article on the DTU by Andy Mallon.

If you are not sure what your workload might be in Azure, there are a number of DTU calculators available that can help.  Here is a link to one, DTU Calculator.

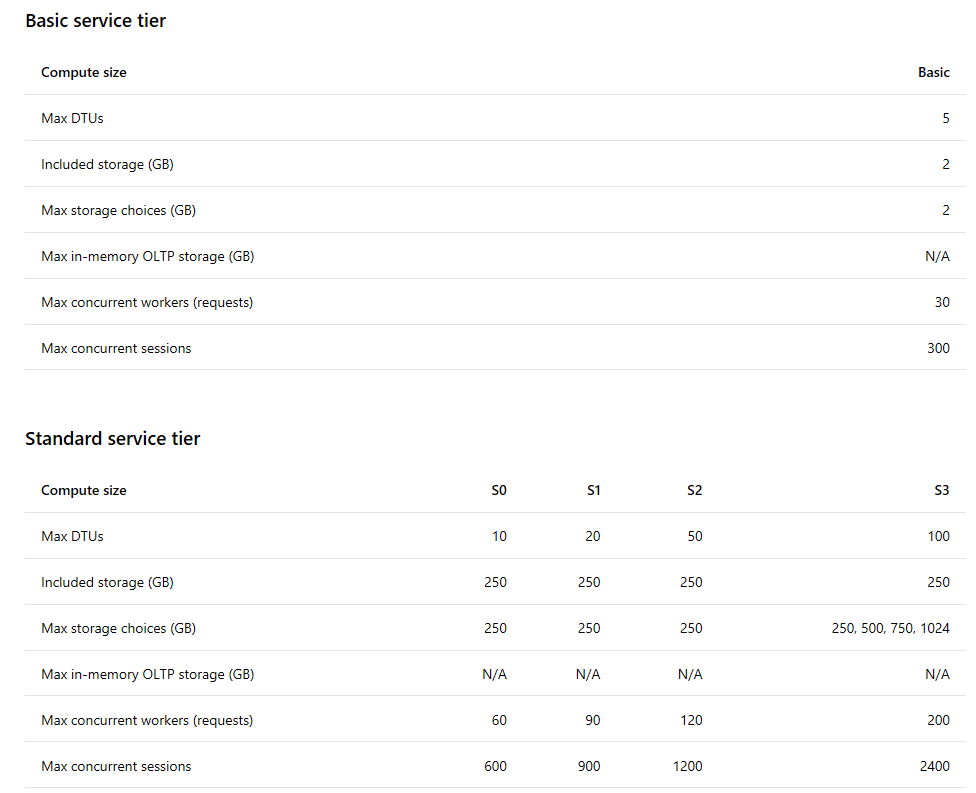
As for the how many DTUs you can have, that will depend on the tier that you have chosen.  Below is a sample of a chart from Microsoft that outline the limits of two of the tiers.  Notice that there are a number of options for Max DTUs. Source of the chart is here. As you can see, the Max DTUs goes from 5 to 100.  It even goes higher if you have are using the Premium tier.

Per Microsoft, you have up to the Max DTU for your tier before you will be charged.

The DTU price for a single database includes a certain amount of storage at no additional cost. —Microsoft

Of course this might change at any moment, so I have to make a disclaimer.  Always consult your MS rep or Licensing expert to get the exact pricing and rules.

As I stated earlier, it is important to monitor your work load to see if you are at a position in which you might be throttled.  Azure is a pretty good set of monitoring reports that you can create.  You can use the metrics reports to accomplish this.  Here is a link to my post on how to create a metrics report.

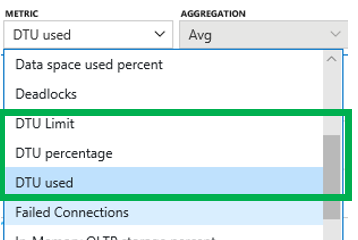
So what should you monitor?  Well since we are talking about an Azure SQL database, you have three options for measure DTUs.


DTU Limit – this is what you think it might be, the limit for your tier.

DTU Percentage – this is just that, the percentage of the DTU max that is being used.

DTU Used – this is the current DTUs that are being your by your workload for the database.

This post is less about DTU calculation and pricing tiers and more about does it make a difference if I use SSMS or the Azure Query Editor on the use of DTUs.

From the tests that I have completed that answer is no.  Using Azure Query Editor showed little or no improvement in the use to DTUs.

Before we get into the results of the test, let’s cover a few basics of what I did.  I used the AdventureworksLT sample database that you can get from the Azure portal when creating a new sample database.

This is the query I ran this query using both tools.

SELECT TOP 100000 *
FROM saleslt.salesorderdetail a
CROSS JOIN saleslt.salesorderdetail b

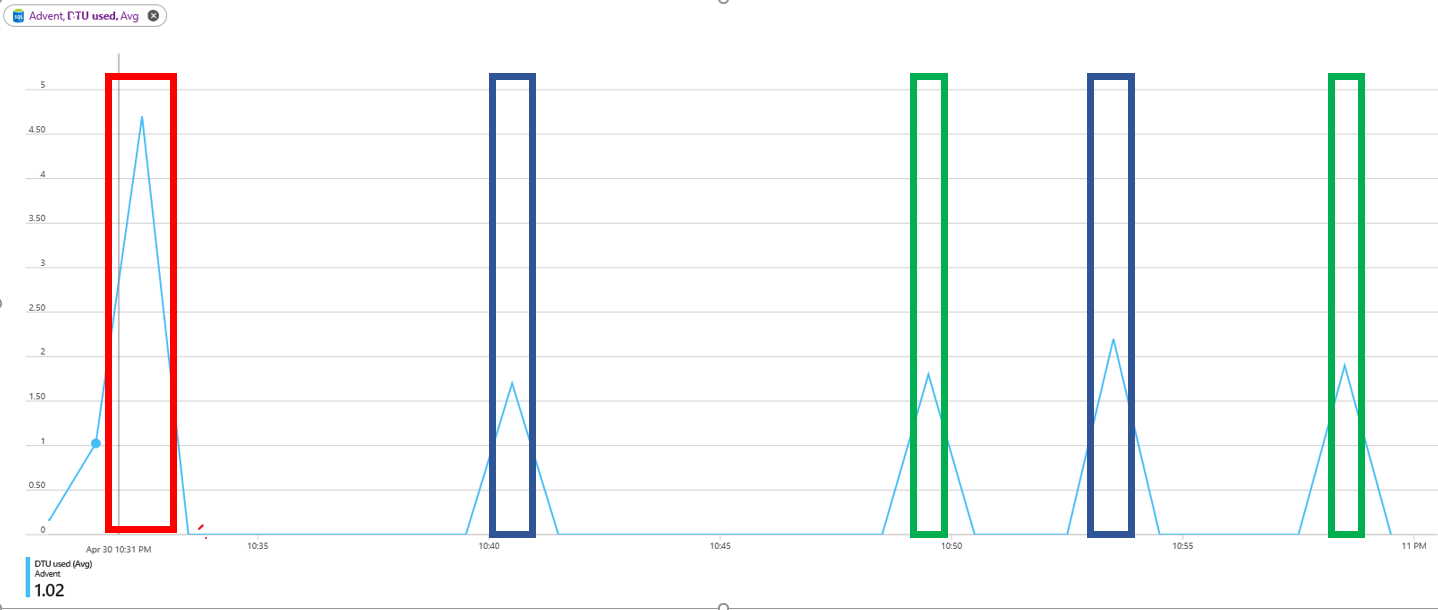
In the chart below the green boxes represent the test using SQL Server Management Studio, while the blue boxes are the executions in the Azure Query Editor.  Notice that there is very little difference in the DTU usage.

Although there really isn’t much difference in DTU consumption, I did notice something I didn’t really didn’t expect.

When I ran the query in SSMS is usually took less the 3 seconds to run.  However, when I ran the same query using the Query Editor, it usually took 45 to 60 seconds.  That is a huge difference.  Also note that in the above chart, the Max DTU never reached 10, which is my limit.  Because if this, I know that I was not throttled by Azure.

You might be wondering with the red box is.  This is the test when I ran this query.

SELECT *
FROM saleslt.salesorderdetail a
CROSS JOIN saleslt.salesorderdetail b

The only difference it that it doesn’t have the TOP keyword.  What is interesting about this is that when I ran the query in SSMS, it took about 45 seconds.  However, when I ran in the Query Editor, it was pushing 5 minutes before I cancelled it.

How can I get information about the MAX DTU for the Azure SQL Database?  There are a few DMVs that you can use.  The first on is the dm_db_resource_stats.  This can be used to the Max DTU, as well a number of other bits of useful information.

If you run this query in your Azure SQL Database you can get the information.  The column you want to look for to get the Max DTU limit is DTU_limit.  Here is a link to get more information on this DMV.

SELECT * FROM sys.dm_db_resource_stats;

However, if you try to run it in the Master database, you will get this error:

Msg 262, Level 14, State 1, Line 1
VIEW DATABASE STATE permission denied in database ‘master’.
Msg 297, Level 16, State 1, Line 1
The user does not have permission to perform this action.

You can also use he sys.resource_stats dmv to get the DTU limit.  This DMV has the same column name as above, dtu_limit.  This DMV must run in the Master database.  Here is a link to get more information on this DMV.

SELECT * FROM sys.resource_stats

If you try to run it in another database, you will get this error.

Msg 208, Level 16, State 1, Line 3
Invalid object name ‘sys.resource_stats’

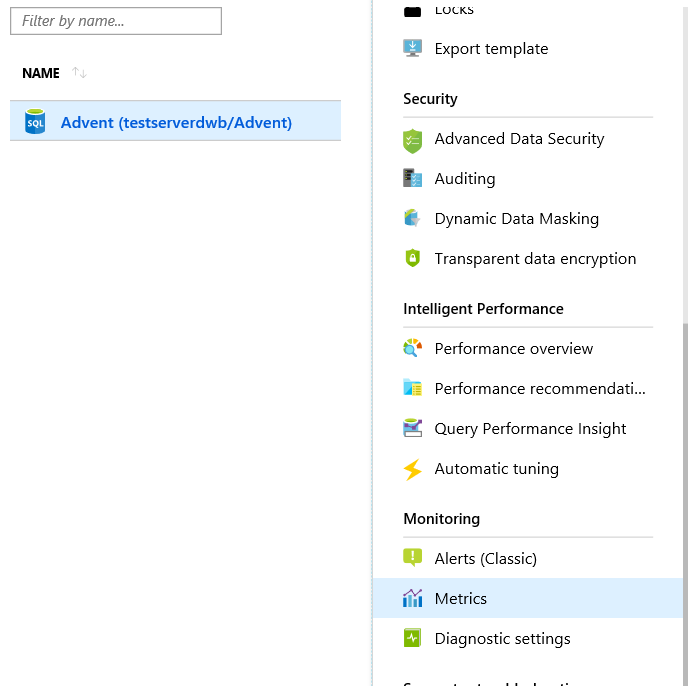
How do I get to the metrics report. This is pretty straight forward.  Navigate to your Azure SQL Database in the portal.


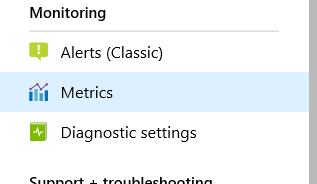
As you can see, in the menu on the side you will see the Metrics items.  If you click it, You will then be taken to an Azure Reporting tool.

You will then create your report.  This my post on the Metrics Report.

Thank you for stopping by and I hope you learned something.

Disabled Database User?

In my many years of working as a DBA, I have encountered many disabled logins.  However, I have never really encountered what looks to be a disabled database user account.  I didn’t even think it was possible to disable a user account in a SQL Server database.  I checked the user account properties just to makes sure I was correct.  Sure enough, no option to disable a user account. This finally turned out to be a simple case of looks can be deceiving.

When we first received the call that a user was having an issue, we asked what was the error.  This is what we were sent:

For the purpose of this blog, we will be using a SQL login named, testuser.

My first thought was maybe a permissions issue.  I very quickly realized that it was something else.

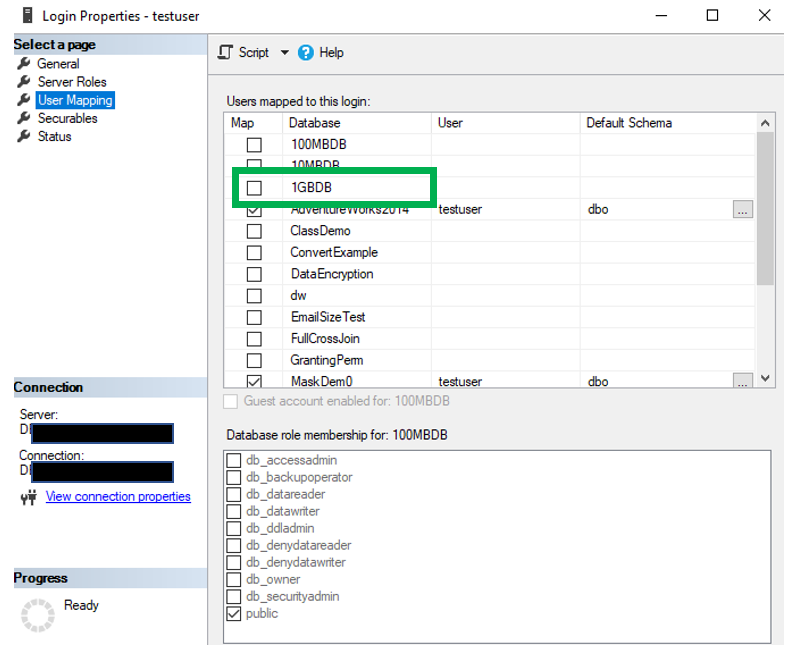
The first thing I did was look at the properties of the login.  This clearly showed that the login had access to a few databases, except the one related to the reported error, 1GBDB.  As you can see below, it looks like the login doesn’t have access into the database.


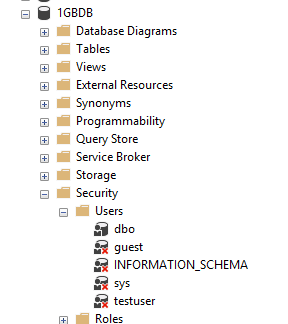
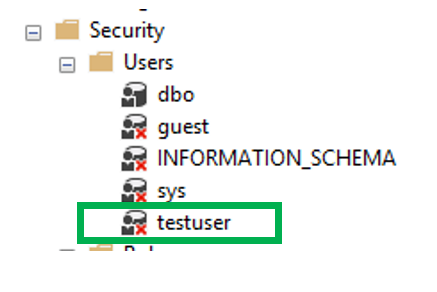
However, if you look at the users in the database, you can see that the account does indeed exist in the database.  As you can see below.

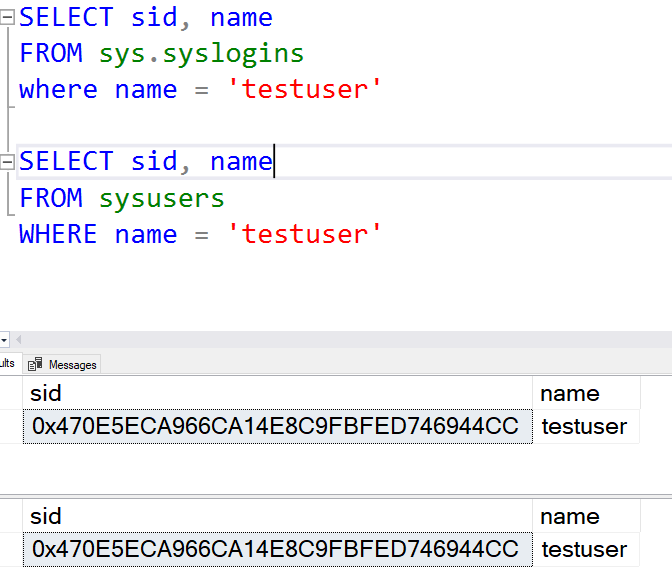
Of course the red “x” on the user account was a bit suspicious, we will get into that in a bit.  One of the items I checked was if we have an orphaned account.  So I check the SIDs for the login and the user account using these queries.

SELECT sid, name
FROM sys.syslogins
WHERE name = ‘testuser’

SELECT sid, name
FROM sysusers
WHERE name = ‘testuser’

Here are the results.

As you can see, the SIDs for both the user account and the login are the same. So that rules out an orphaned account.
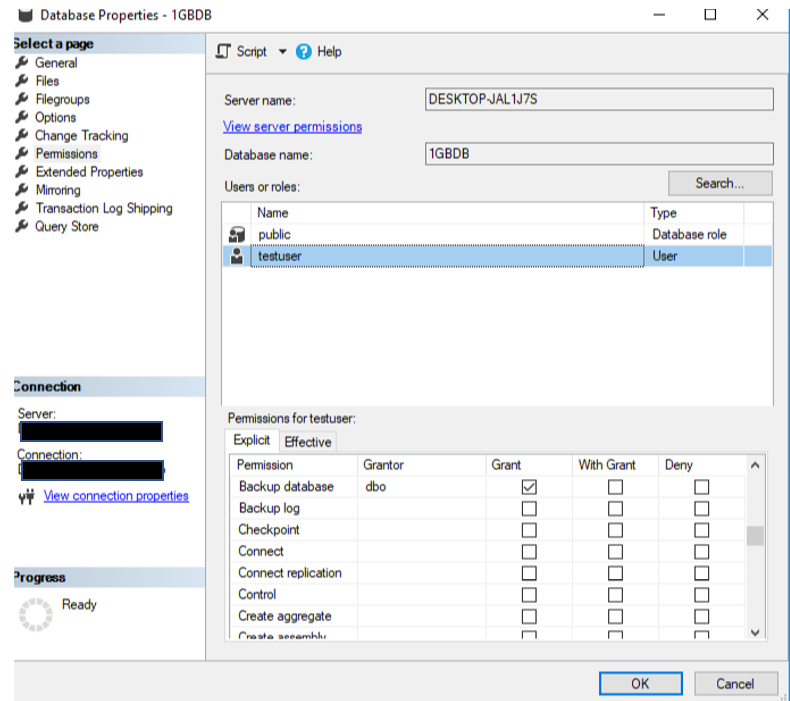
I still couldn’t figure out why they user couldn’t get into the database.  That red ‘x” was still bothering me.  After some checking, I discovered there was something different about the user account in this database, 1GBDB, when compared to the same user accounts in different databases.

Database Permission properties for the 1GBDB, which the user cannot connect to.

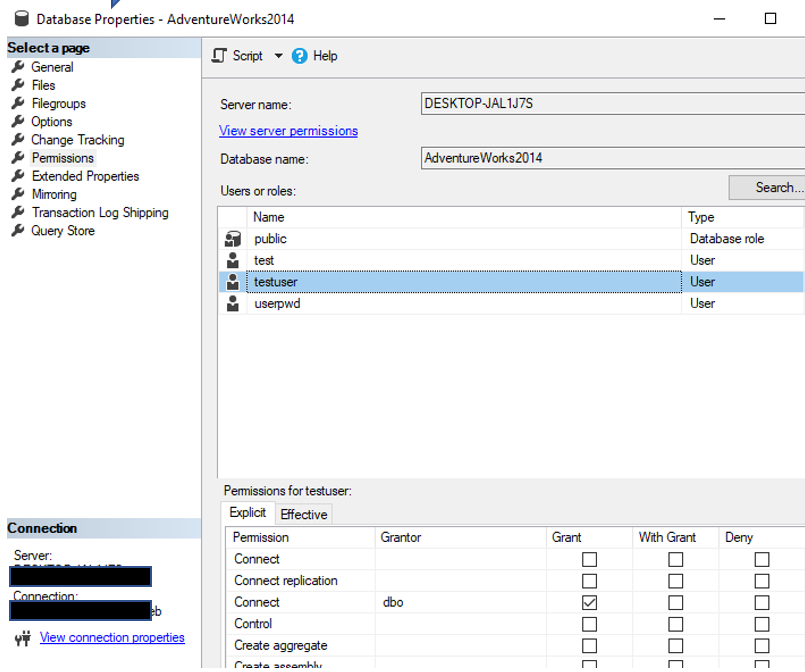
This the a screenshot of the database permissions for the AdventureWorks2014 database, which the user can get to.

There is one important difference, the Connect permissions.  If you remove the “Connect” permissions from a user account in a database that has a corresponding login, you will see this.

Once you grant the Connect permissions for the user account, the red “x” goes away and all should be good.  Unless of course there are other issues.
Thanks for stopping by and I hope you learned something!

Azure SQL DB Query Editor

We have all been using SQL Server Management Studio to query and manipulate data, even for an Azure SQL database.  There is also an option to do this same thing built into the SQL Azure database interface in the Azure portal.  Although there have been a number of posts related to this topic dating back a few years, this feature is still marked as “preview” in the Azure portal.

How to get to the Query Editor

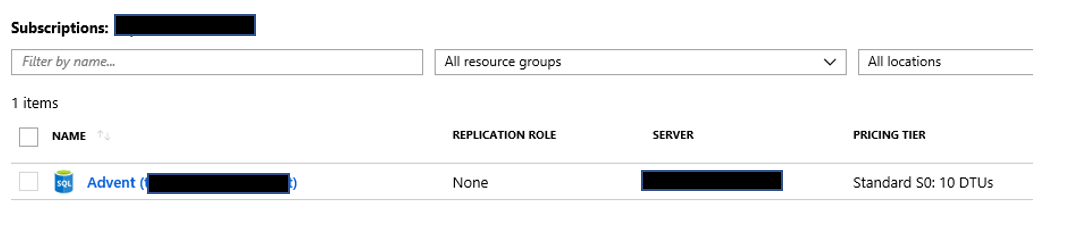
Once you are in the SQL Database list in the portal, find the database you would like to work with and click it.

When you do, you will be taken to the administration page for the database.  On the left side you will see the “Query editor” link.  You will also notice that this is a feature that is still considered to be in preview.
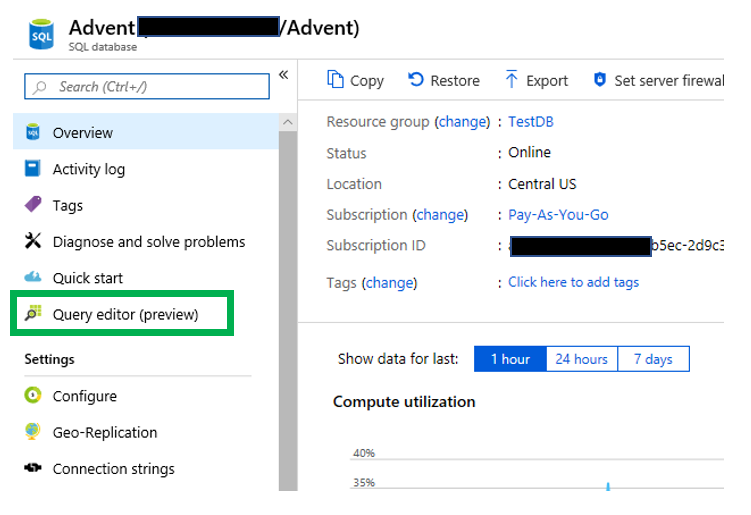
When I did a Google search on the Query editor in the Azure portal, I found posts from as far back as 2017.  Despite that, I still wanted to complete a blog post on it.  Once you click it, you will be taken to a login page similar to below.
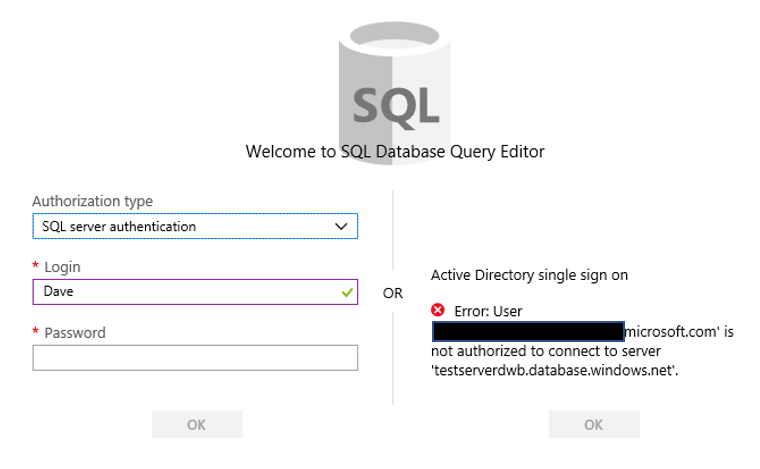
Notice on the right side there is the ability to utilize the Active Directory single sign on functionality, which I do not have.  On the left you will enter the appropriate credentials to login to the database.
Once at the Query Editor

Once you are in the Query editor, you will notice many of the same features as SSMS.

These features include the following

      • Tabs for new queries
      • Open query
      • Results pane
      • Messages pain
      • A condensed object explorer
      • as well as many other features of SSMS

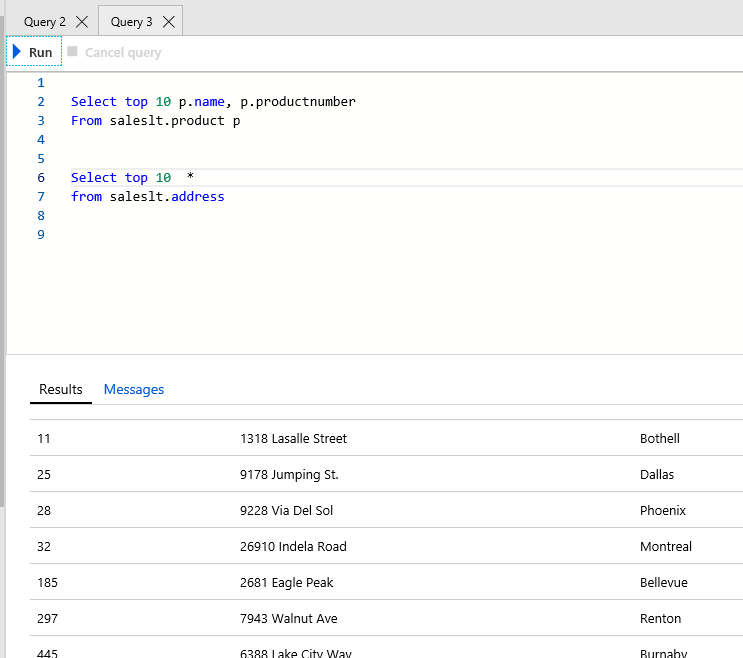
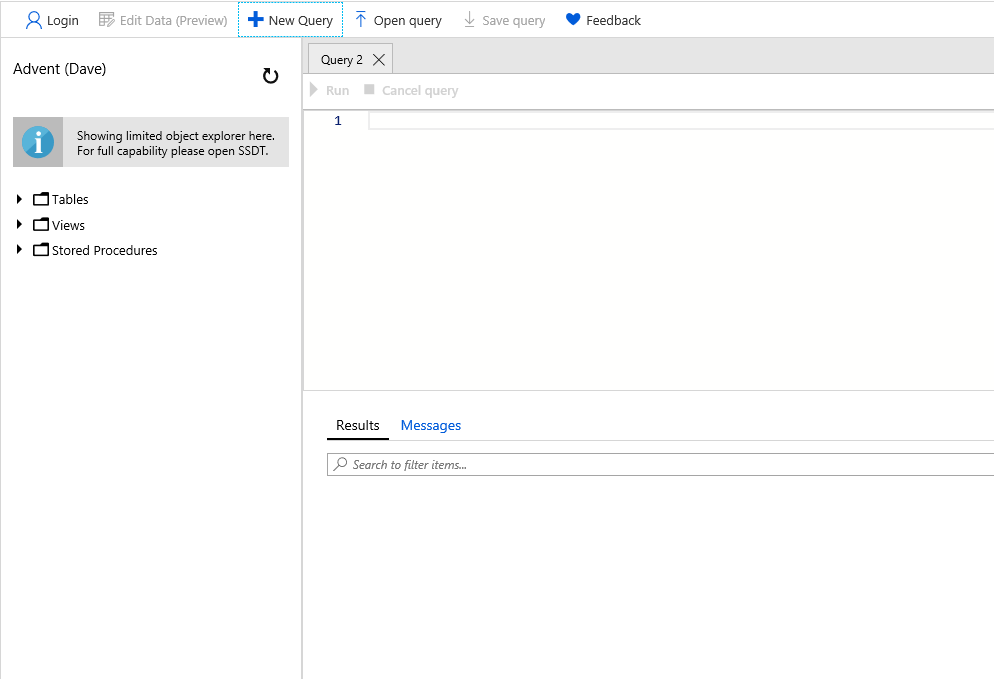
Below you will find a screenshot of the Query editor interface.

Menu Bar

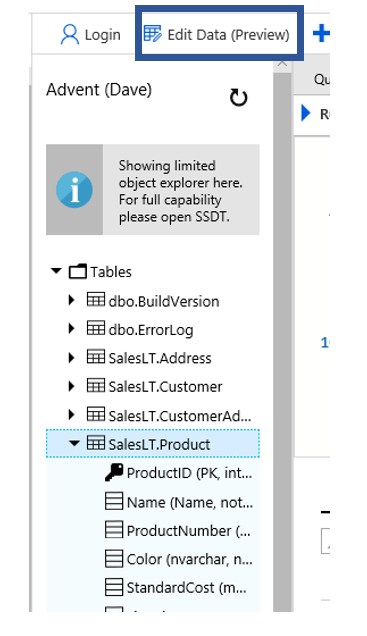
Starting with the menu bar across the top, you will find the expected buttons.  In addition to the Open query, new query and save query buttons, there is also an Edit Data(Preview) button.  This does as you expect it might, allows you to edit the data.  Just like the Query editor, this is also a preview feature. There is also a Login button if you wish to use a different user.

Object Explorer


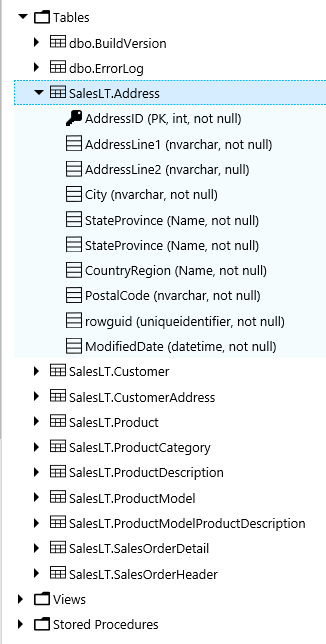
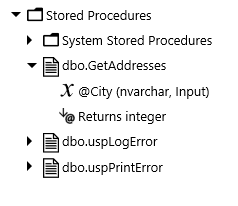
The Object explorer is very similar as that in SSMS, however there are some very glaring differences, mostly that there are fewer object types displays in Query editor.  As you can see you can browse tables, views and stored procedures.  As for the tables, you can see the column names and data types as well. For stored procedures, you are able to see the parameters just as the image below indicates.

In SSMS a user can right click on a stored procedure and execute it.  In the Azure query editor, when you right click on an object you get nothing.  The context menu does not appear, therefore not allowing you to execute the procedure.  Of course you can still use T-SQL to execute a stored procedure.

Query Window

In many aspects the query window is very similar to that of SSMS.  There are tabs across the top, the T-SQL pane, a results pane and a messages pane.

Starting with the T-SQL pane, there is color coding of the SQL, however it is slightly different than that of SSMS.  First big difference is that there is not an option to change the size or color of the font.

If SSMS if you execute two SELECT statements, like the ones below, the results are much different in Azure Query editor when compared to the same two queries in SSMS.

SELECT TOP 10 p.name
, p.productnumber
FROM saleslt.product p

SELECT TOP 10 *
FROM saleslt.address

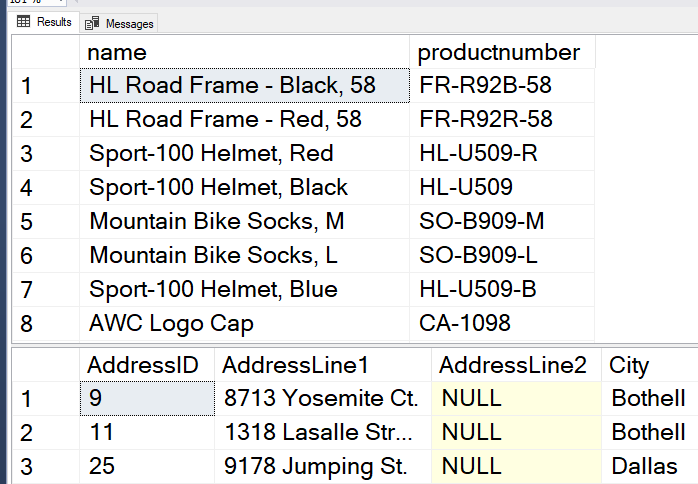
Here are the results when you run the code in SSMS.  Notice that there are two data sets

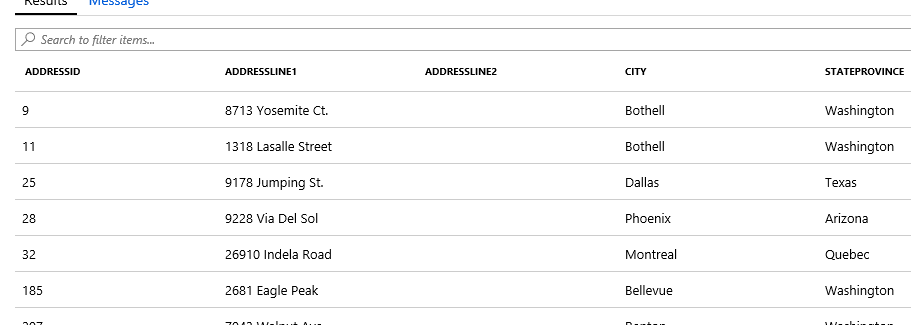
Now look what happens when I run the same queries as the Query editor, I only get one data set vs the two when executed in SSMS.

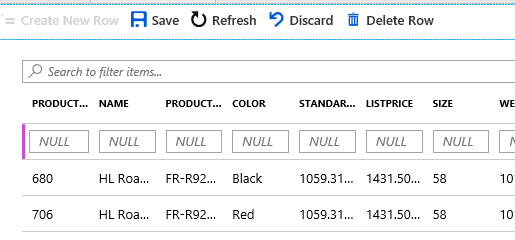
In SSMS, if you right click on a table you will see an option to Edit X number of rows.  That options is very similar in Azure Query Editor. The way this is done in the portal is to click on a table and then click the “Edit Data (Preview)” button just to the right of the Login button.

This will in turn, return the data in a grid that allows for editing data. You can just double click in a cell in the results set.  This will change the cell to an editable version.  The edit menu has just 5 buttons on it.

The are:

        • Create New Row
        • Save
        • Refresh
        • Discard
        • Delete row

When you click the new row button, the new row will appear in a different location that if you attempted to enter a new record use the grid results set in SSMS.  The big difference here is that the new row will appear at the top of the grid.

One option that is important to me is the ability to change the font size.  I have NOT found out how to do this in Azure Query editor.
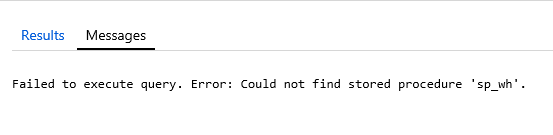
When you execute a statement and an error is returned.  In SSMS this error is red, but default. In the Query editor it is black.

Once you have your query as you like, all you have to do it click the Run button
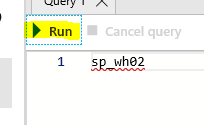
Limitations

There are a number of limitations in the Query editor at this time.  Since it is in preview, my hope is the Microsoft will address some of these deficiencies as the Query editor moves closer to having the preview label removed.

      • Does not allow for the viewing of object definitions
      • Limited objects in object explorer
      • Tabs in the query window does not have the SPiD on it
      • If more than one SELECT statement is executed in a batch, you will only see the results of the last one
      • Cannot right click on a stored procedure to execute it
      • No options such as display Actual Execution Plan
      • Cannot drag and drop object names into the query

Despite all of the limitations, I still like it.  Once you get used to the limitations it really isn’t that difficult to use.  Since the name of the tool is Query Editor, it does make sense that it doesn’t have all the same functionality as SQL Server Management Studio. However, it would be nice to have some the items that are currently not included.

Thanks for stopping by and I hope you learned something small.

How to Move an Existing Database to Azure SQL DB

When moving the enterprise to a cloud based solution such as Azure SQL Database, we will need to find a way to migrate existing database to the cloud.  I already completed a post on how to create an Azure SQL database.  This post will focus more on how to migrate an existing on-prem databases to an Azure SQL Database.  There a several options that you can use, use the “Deploy Database to Microsoft Azure Database…” option in SQL Server Management Studio, Data Migration Assistant tool or use the Azure Database Migration Service.  During this post I will cover all three options.

Deploy Database to Microsoft Azure Database…

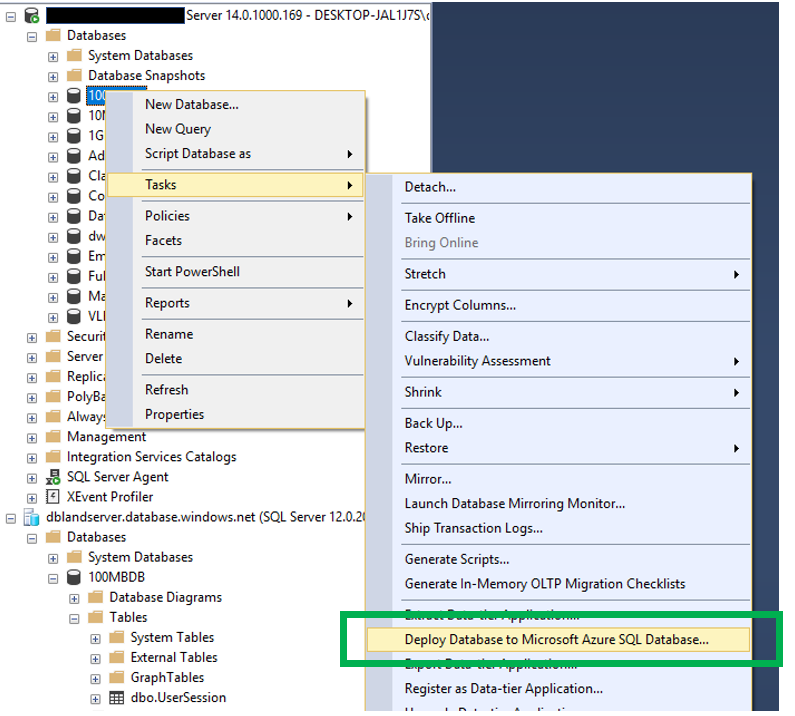
After opening SSMS, move to the database you wish to move to Azure SQL Database and right click on it.  When you do, you will see this:

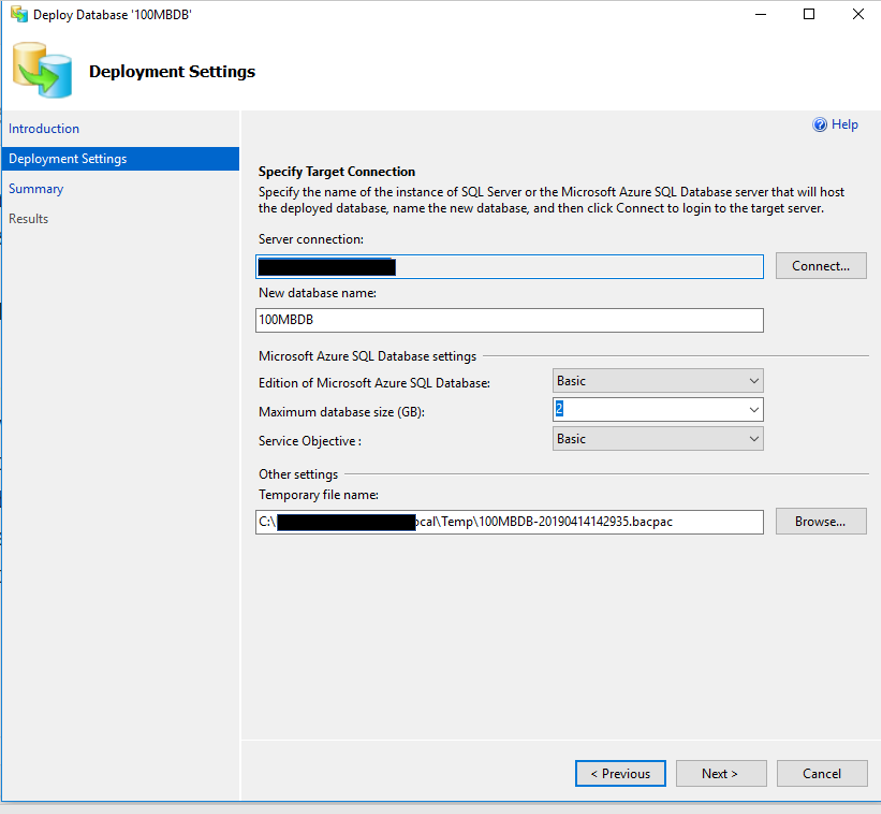
After clicking the first next in the wizard,  you will then be asked to provide some detailed information about what you are attempting to migrate to Azure SQL Database.

This information includes the following:

  • Server Connection – this is the Azure location you are attempting to migrate to
  • New Database Name – this will default to the name of the database you right clicked on, but can be changed in Azure SQL Database if you have a need to change it
  • Azure SQL Database Settings – these will not be active until you identify a Server Connection
      • Edition of SQL Server
      • Maximum Database size
      • Service Objective
  • Temporary File Name – This is the name and location of the .bacpac file.

What is a .bacpac file?  Since you may not have worked with this before, I thought I would take a few minutes to go over exactly what a .bacpac file is. It is considered a Data Tier Application that can be used for deploying databases from one location to another.  This file will contain both schema, object definitions and data.  There is also a .dacpac file type.  The only difference between the .bacpac and .dacpac is that the .bacpac is the only file type that also contains the data.

This is what the screen will look like.

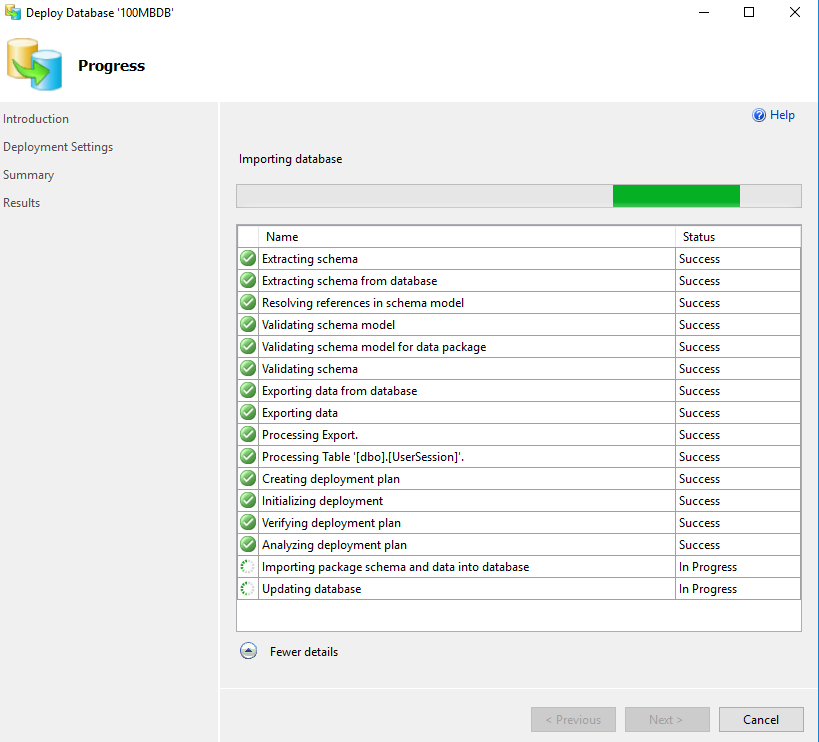
When you click “Next”, you will have an opportunity to review all the settings before clicking “Finish”.  When you do, you will see the progress of the migration, step by step.

As you can see above, there are number of steps.  You can also see that there is a step named “Processing Table”.  This step will show each table as it is processed and migrated to Azure SQL Database.  Once the migration is completed, you will now see the database in both locations, the original SQL Server and in Azure SQL Database.

Data Migration Assistant

This is a relatively easy tool to use.  It really has two purposes.  One to assess an on-prem database to identify what challenges you might encounter when migrating at database to Azure and the other to actually complete the migration.

This is a tool the must be downloaded and installed before using.  To download it you can go here.  Download DMA.  Once downloaded and installed you will find it list as “Microsoft Data Migration Assistant” in the Start menu, not under the SQL Server items.

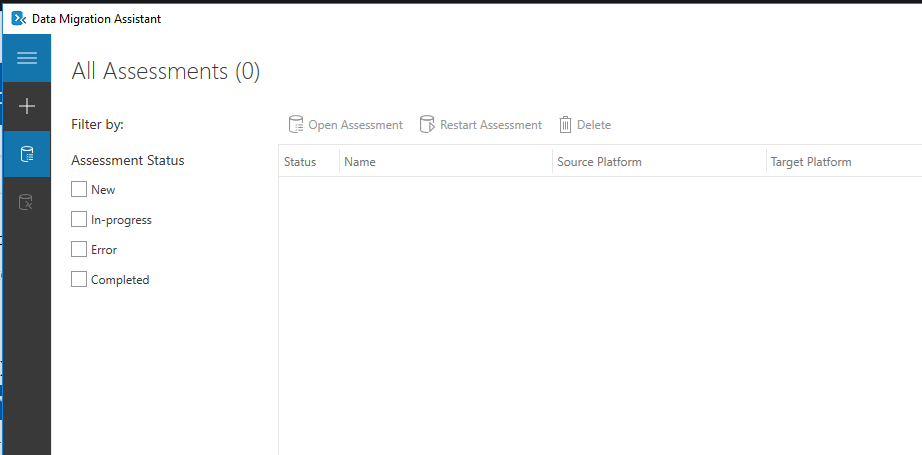
Below you will see the opening screen in the DMA.  As you can see there are two options, completed an assessment or do a migration.  By clicking the “+” on the left side you will have an option to chose what you would like to do.  Notice that there are also options to restart an assessment or open an assessment.  These are exactly what you might think they are.  When you complete an assessment you will be able to save the results or save the configurations of the assessment that you can restart if you like.

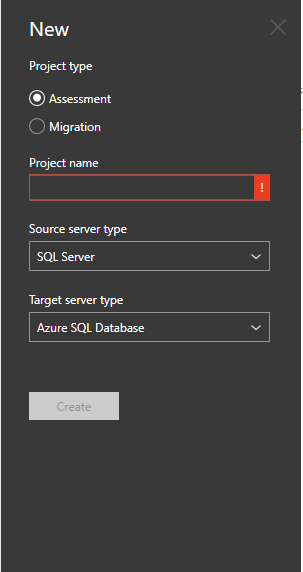
When you click the “+” sign you will then see a few options that you can chose from.  Here you will be able to chose to complete an assessment or a migration.


Both of which will require a project name, a source and target server type.

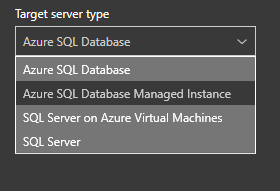
You will have several options for a target as you can see in the image below.  Since this blog post is about the migration of a database, we will focus on that target.

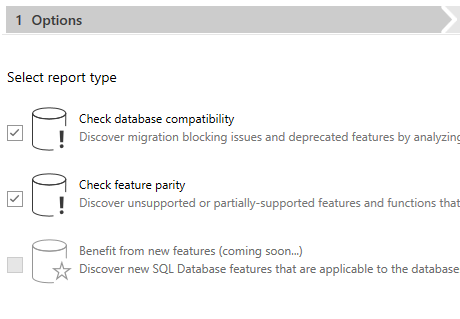
Once you pick you source and target, you will then be able to click the “Create” button.  Once you did, you will see this.  You will see three options, although only two are available at this time.  The two options that are available are Check Database Compatibility and Check Feature Parity.

Once you click “Next” you will then be asked to identify a source.  Since this post is about migrating an on-prem SQL Server database to Azure SQL Database, the source will be a local instance of SQL Server.  You will have to provide an authentication method and then the database(s) you would like to complete the assessment on.  Once you have provided all the information you can click the “Start Assessment” button.
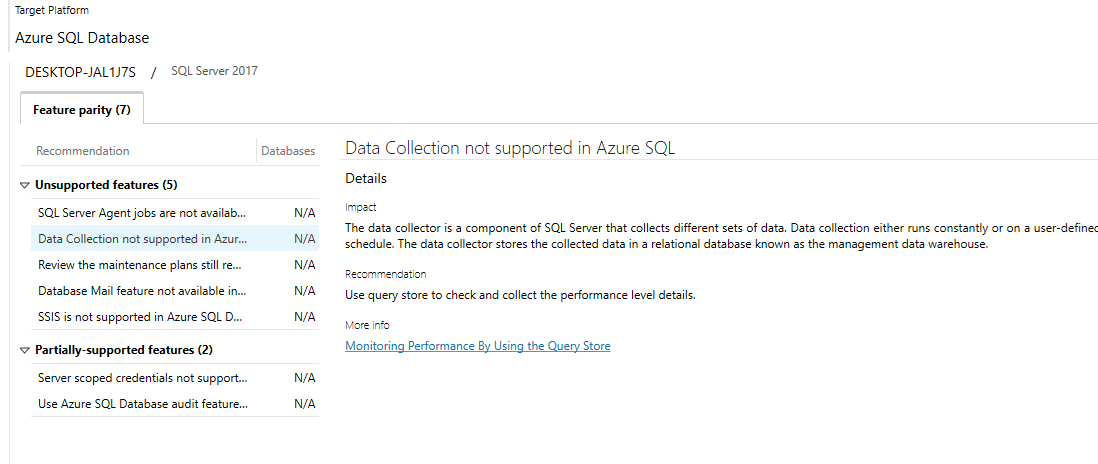
Below is an example of the results of the assessment.  There were a few things that were expected, especially the Agent jobs not being supported in Azure SQL Database.

Fortunately Microsoft has also included links to each of the topics that will allow us to gather more information easily.

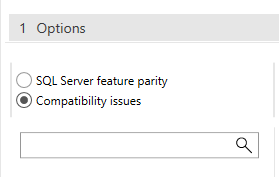
Make sure you look at both groups of items, SQL Server feature parity and the Compatibility issues.  In this case not compatibility issues were found.

Now that we have completed an assessment and addressed all the blocking issues, we can now use the same tool to perform the migration.  As expected you will also have to provide a project name, a source and a destination type.  This will also include the connection information for the target.

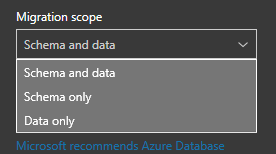
The migration scope has three options.

      • Schema and data
      • Schema only
      • Data only

You just need to decide which is best for what you attempting to accomplish.  In this case, we will pick Schema and Data.

Once you provide all the information, you will be able to click the “Create” button. As part of the migration, there are six steps.  These are list in the image below.

Selecting a source if the obvious starting point for a migration.  Once you do, you will then have an opportunity to pick which database you would like to migrate.
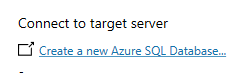
It this is a new database in Azure SQL Database, make sure to click the “Create a new Azure SQL Database…” link.

When you do, make sure you click the Connect button so the list of databases refreshes.
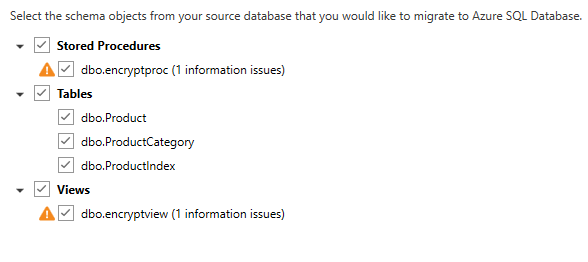
The next step will allow you to identify which objects you would like to migrate.

In this case there are still a few issues that will need to be address, most due to encryption, so I will not migrate those objects.  The next step is to generate the scripts.  Once the scripts are generated, you can save it or copy it.  Note below you the DMA tool will also identify items with assessment issues.
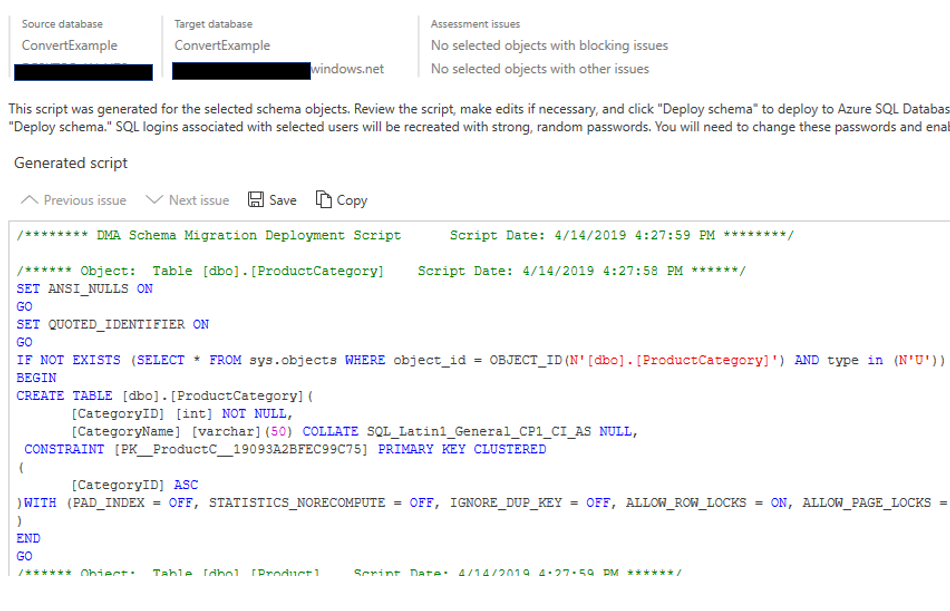
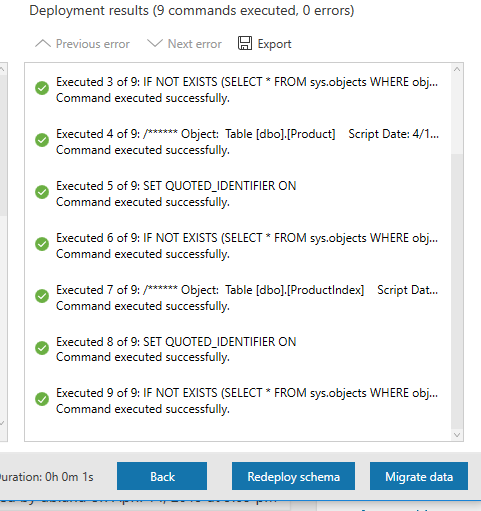
At this point the database has been created in Azure SQL Database and all the objects have been created.  However, we have not reached the point of migrating the data yet.

In order to migrate that data, all we have to do is click the “Migrate Data” button.

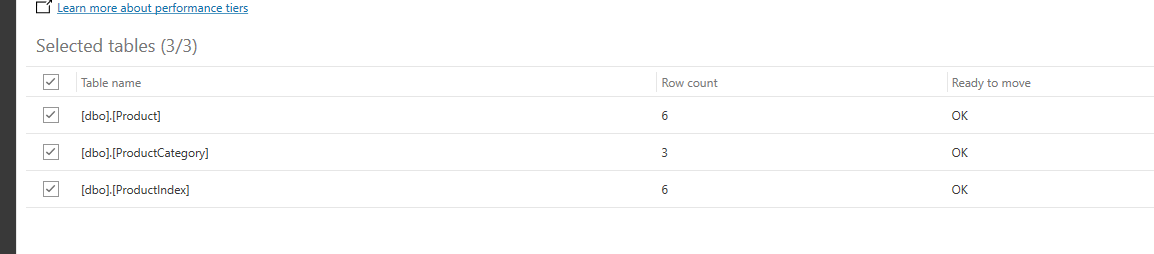
We will now have the option to decide which tables we would like to have the data migrated as well.  As you can see below, we can see the tables listed.  This list include the number of rows and whether or not the table is ready to move or not.

Once you have confirmed the information, click the “Start Data Migration” button.  What I like about this part of the tool is that it tells me the progress of each table and the status of each migration of data.

Now were are done. Not only have the objects been migrated, but the data as well.

Both of these migration options take place on your computer, one with SSMS and the other the downloadable Data Migration Assistance.  In my opinion, I think they are both pretty easy to work with.  The third option is done in the Azure portal.  There is a server called Azure Data Migration Service.  There are a number of required steps to utilize this service.

Azure Data Migration Services

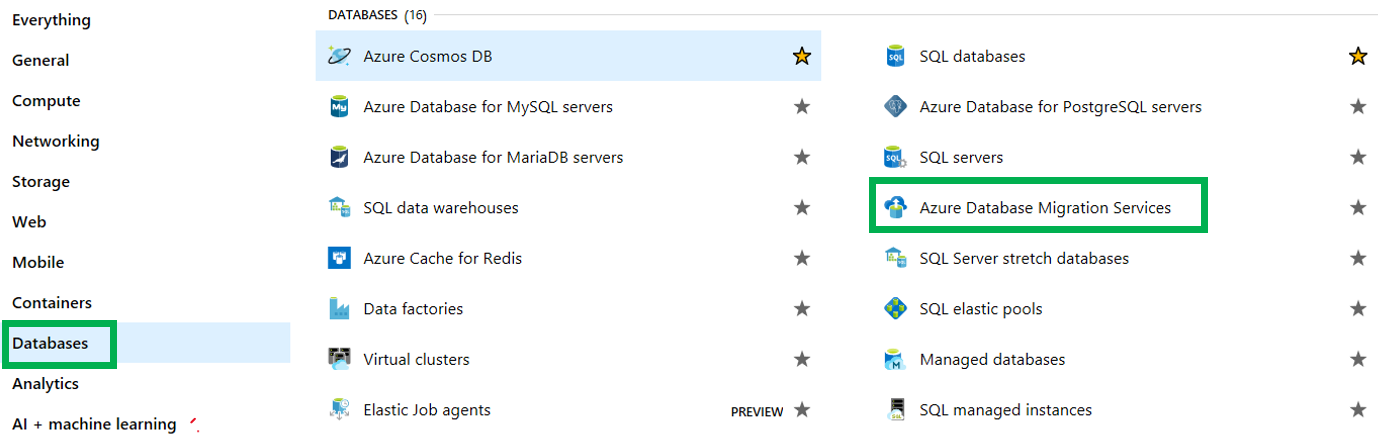
As the name implies, this is a service in the Azure Portal.  When looking at all the services, the Azure Database Migration Services can be found either by doing a search or looking in the Databases group.

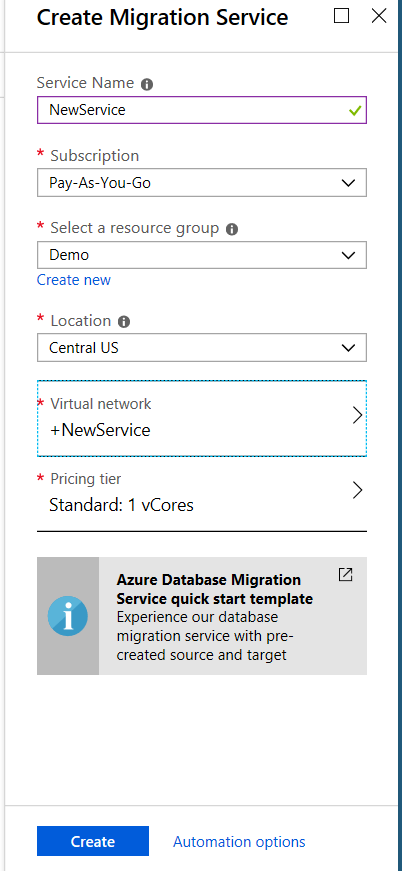
Once you click the Azure Database Migration Service, you will see what is below.  However, if you already have one of this service type running, you will not have to go through this step again.

For this method, you will need to provide a service name, a location(region) as well as a Virtual Network.  Yes, you will need to create a virtual network. This will include the creation of a virtual NIC.

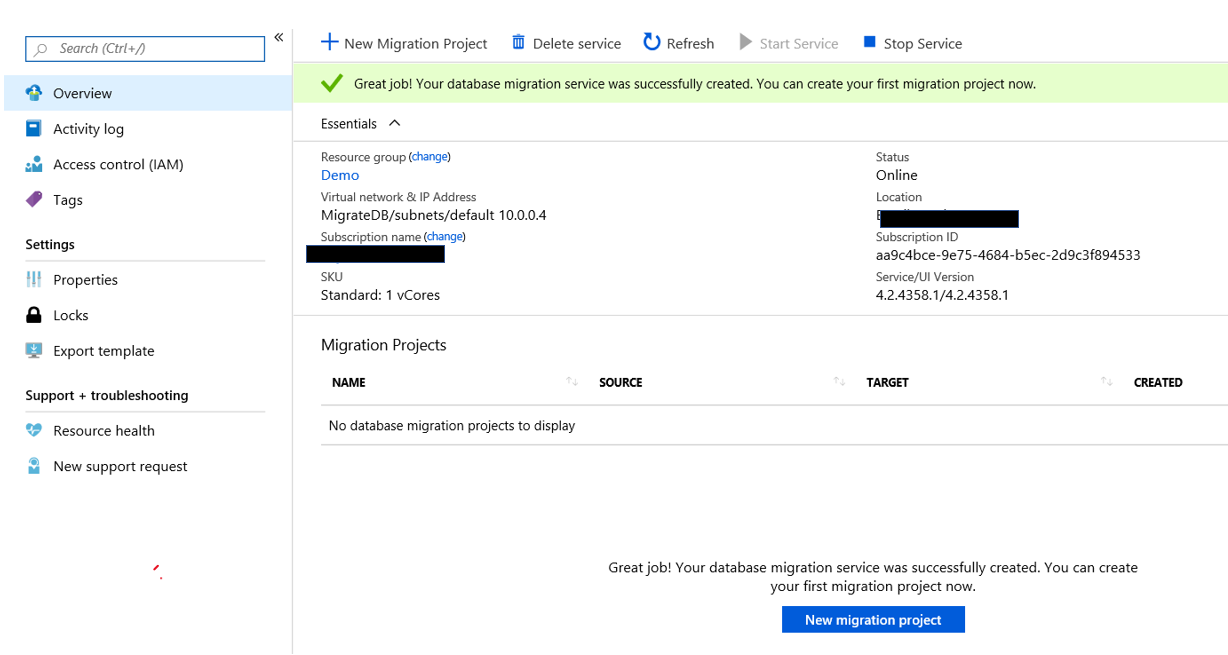
If you already have the service created you can go to the All Resources list in the portal and click that service. Once you do, you will see this.

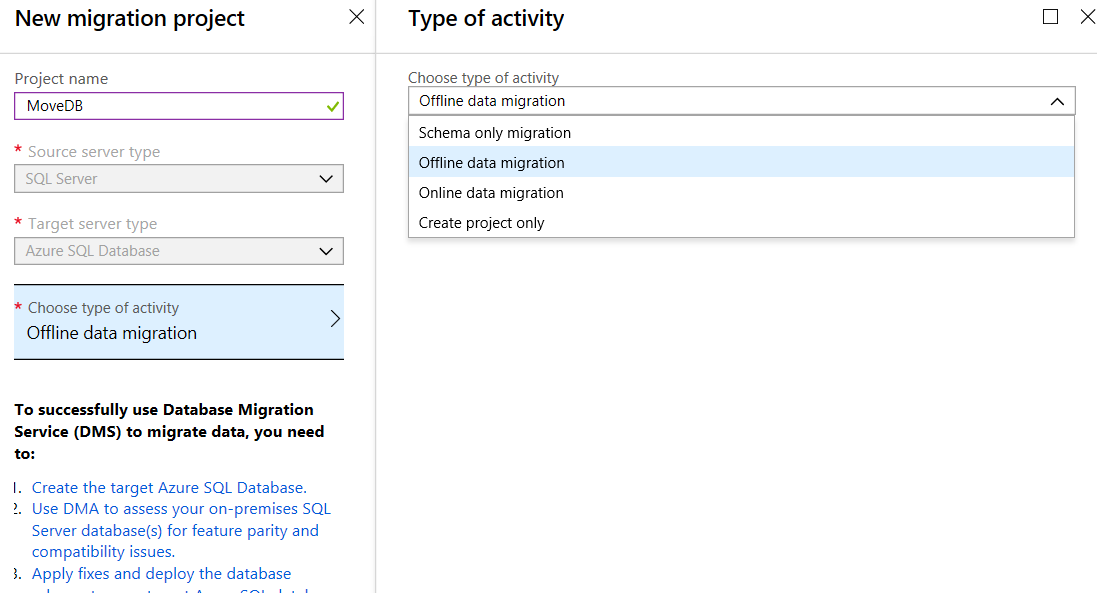
The next step is to click the “New Migration Project” button.  At this point you will pick a data source and a target.

The options for Type of Activity are:

    • Schema Only migration
    • Offline data Migration – this is to be used for source databases that will NOT be changed during the migration.
    • Online data migration – For systems that will be modified during the migration
    • Create project only

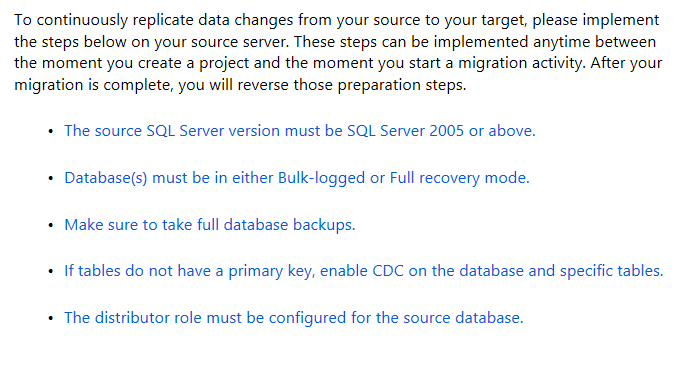
If you chose the Online Data Migration type, Azure with provide you with a list of rules that must be followed in order for the migration to be successful.

Also, if you chose Online Data Migration, it will require a higher level of SKU.  You must have Premium, which I currently do not have.  I received this warning what I tried to use Online Data Migration.
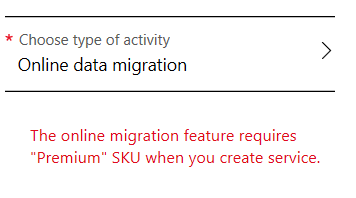
Given this I changed the type of activity to Offline Data Migration.  You will have to complete several steps to be successful in the migration. These steps are fairly basic and expected.  Identify a source, a target, map to target database, configure migration options and a summary.
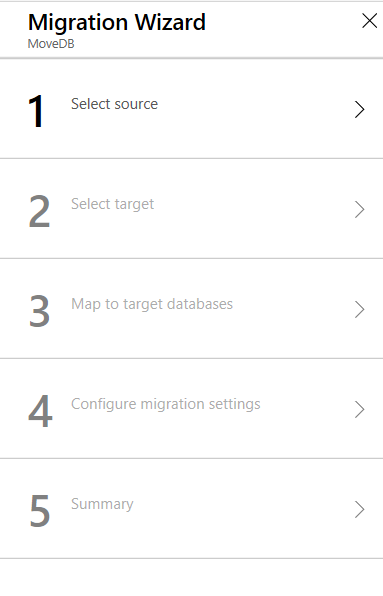
There are a number of network and security steps that must be completed prior to utilizing this service.  This is a good description of what is required, click here.
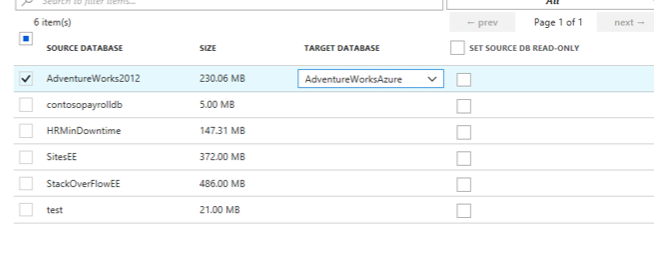
As expected the source and the target require the usual information. What is a bit different is the third step, mapping target databases.  Below is a screenshot of the mapping step that is on the above Microsoft site. As you can see below, you simple map the source databases that you would like to migrate to a destination database in your Azure SQL database portal.

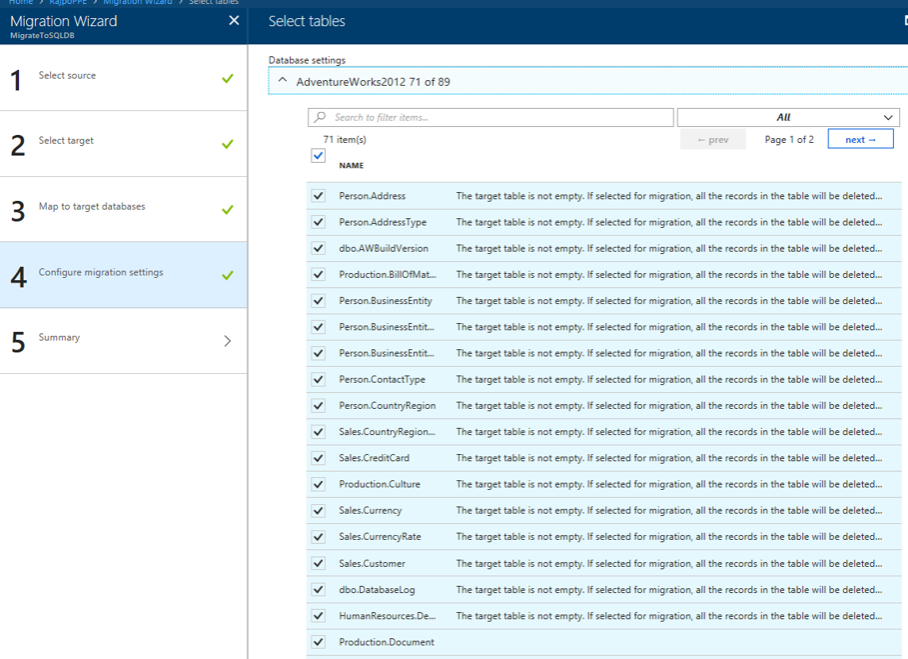
The settings step is simple telling the service what tables you would like to migrate.  Below is also from Microsoft’s site.

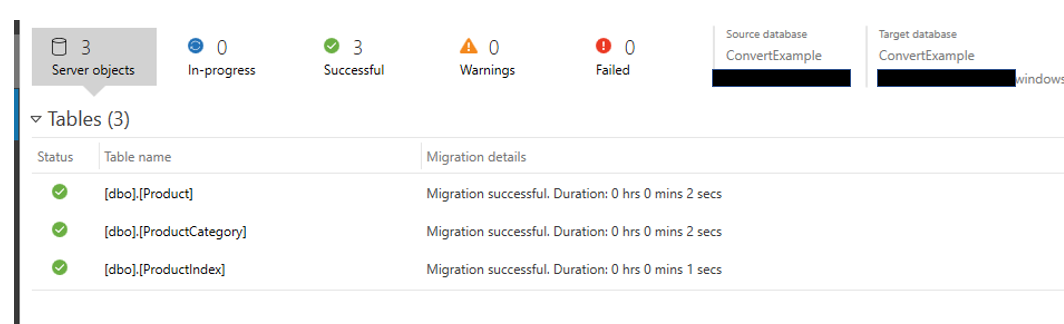
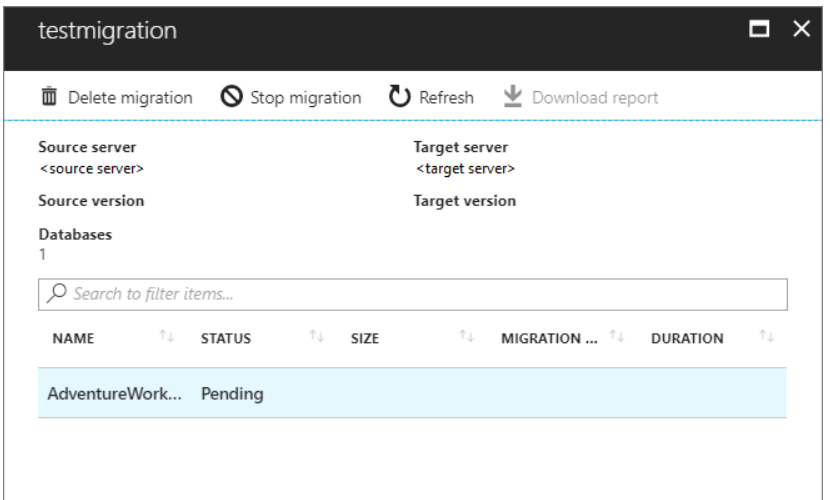
Finally, once you have provided all the required information and you can then begin the migration.  Once you do, Azure will provide progress status that will look like this, also from Microsoft’s site.

It is always good to have options.  In this case we have three different options.  Two you can run from your computer and one that must be done in the Azure portal.  Personally, I like the options of running the migration through an on-prem computer.  They appear to be less involved and I don’t need to involve other teams, such as the network or security team.

When migrating databases to Azure SQL Database, it is important to complete an assessment on the database first using the Data Migration Assistant.  This will allow you to identify what your obstacles might be.  You can then address them before starting the migration.

Thank for stopping by my blog and I hope you learned something.