Extended Events are a great way to find information about what is happening on your on-prem SQL Server. It is also a great way to find out what is happening in your Azure SQL Database. Setting up Extended Events in an Azure SQL DB is very similar to doing so in an on-prem SQL Server.
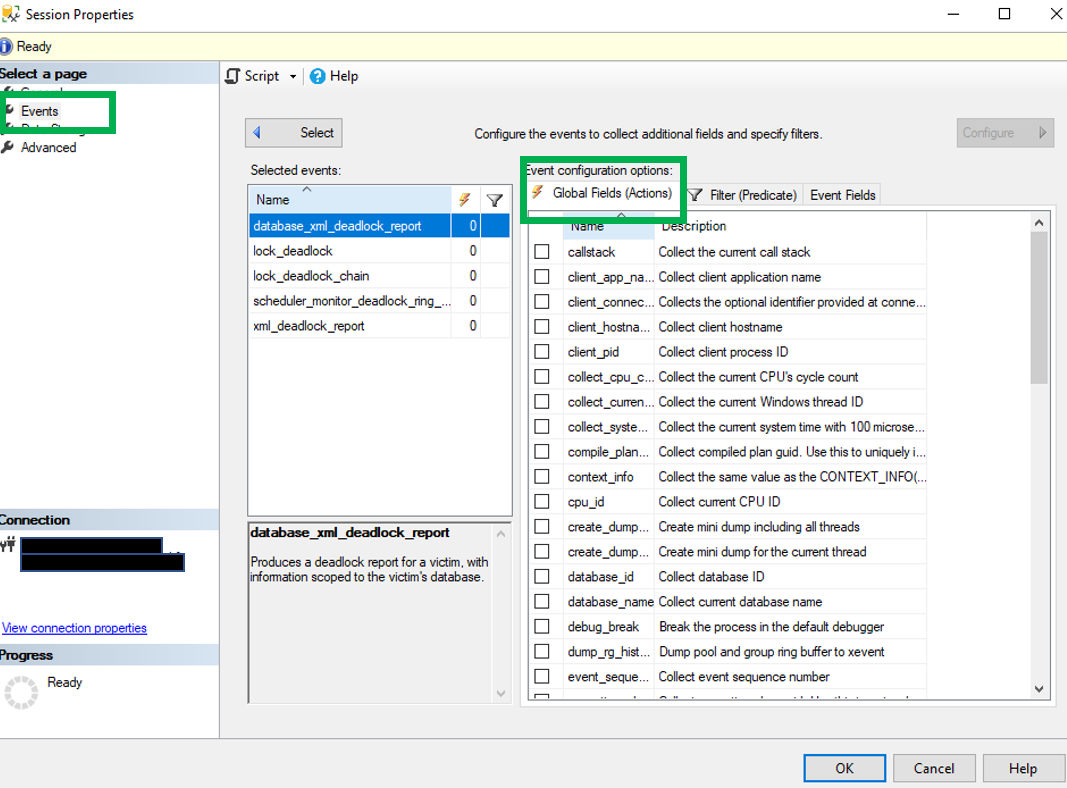
Extended Events can be used to capture quite a bit of information about your SQL Server. With SQL Server 2017 there are over 1,500 events that can be captured. These events include anything from alter column event to query execution plans. When setting up an Extended Events session you will have an option of where you would like to store the collected the data. One of the common destinations for stored the event data is a file. This file is an XML based file and can be read a number of ways.
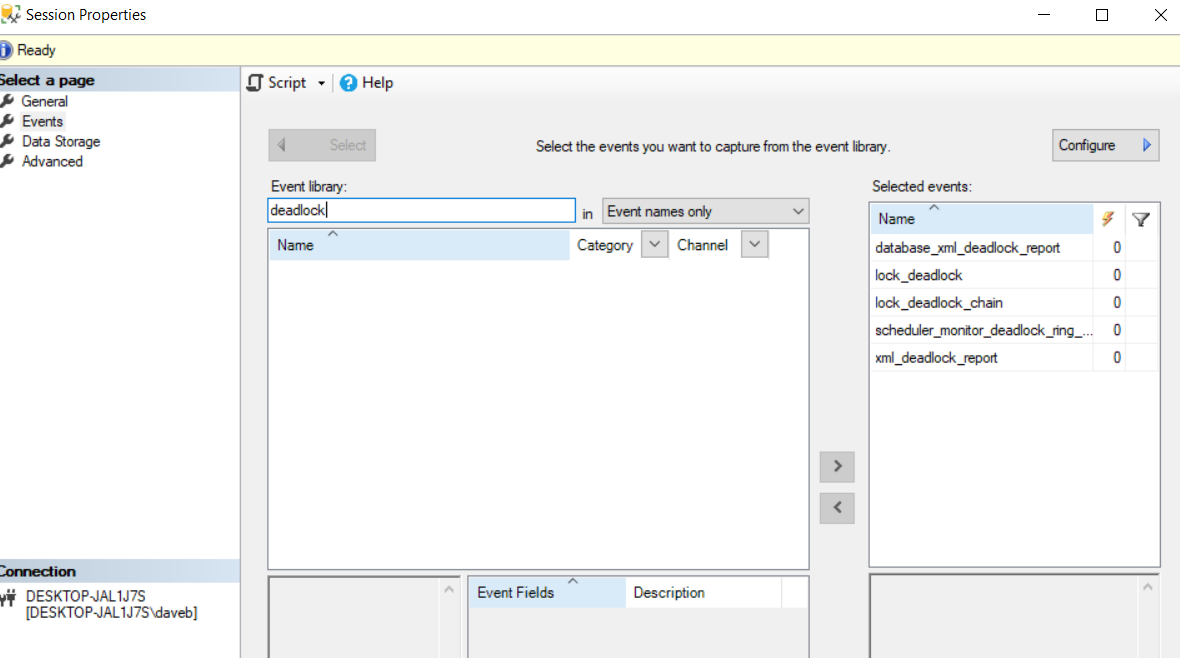
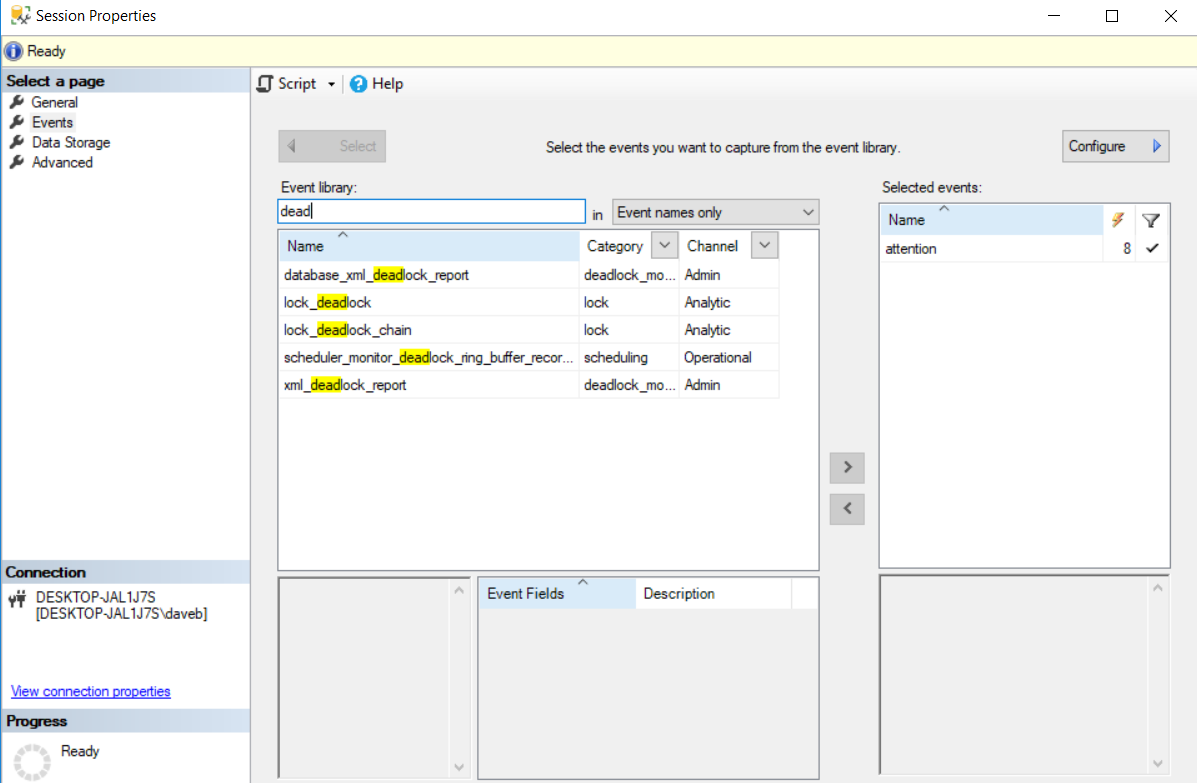
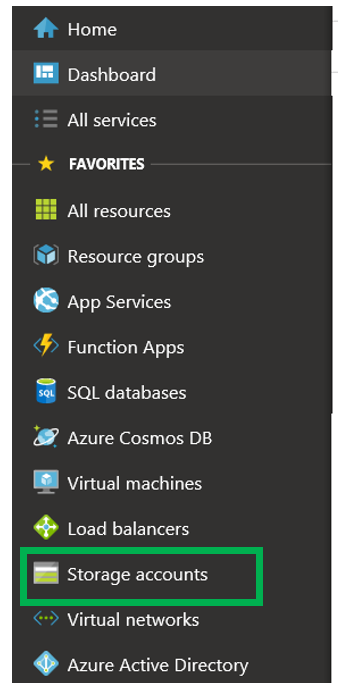
Extended Events can be found under Management and is a server level item.
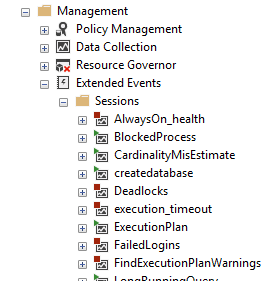
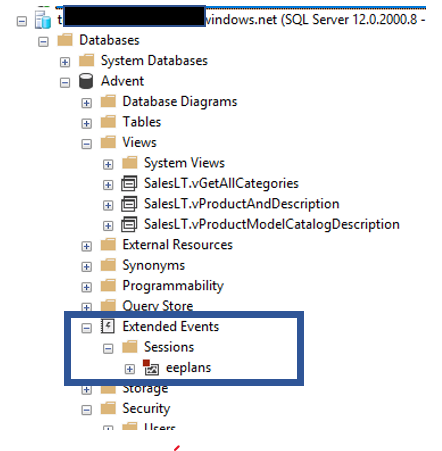
For an Azure SQL Database it has been moved. It is now a database level item.
File Target Basics
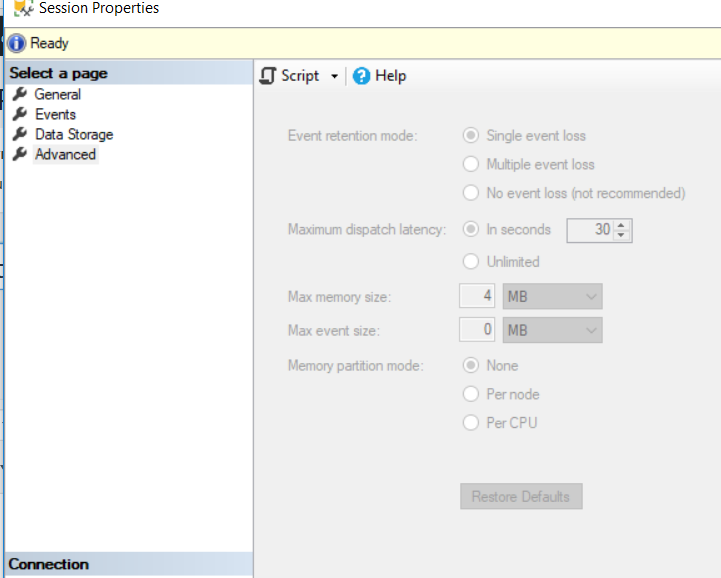
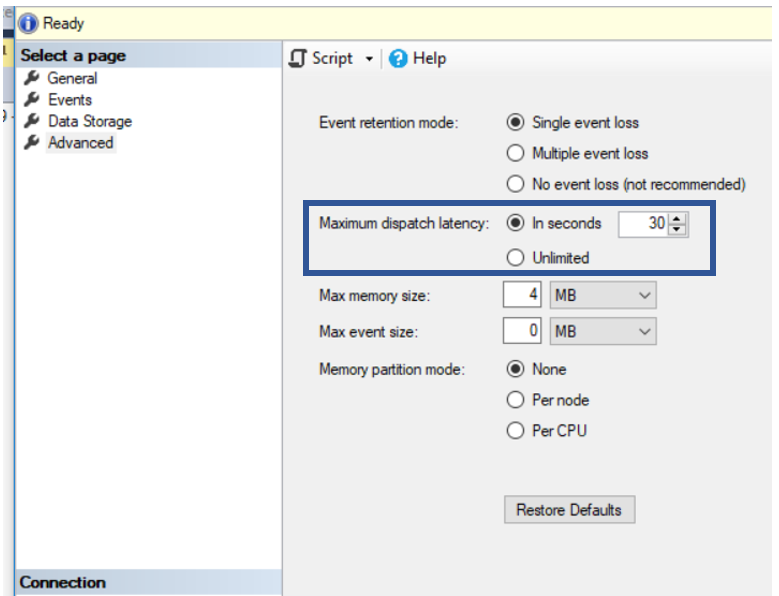
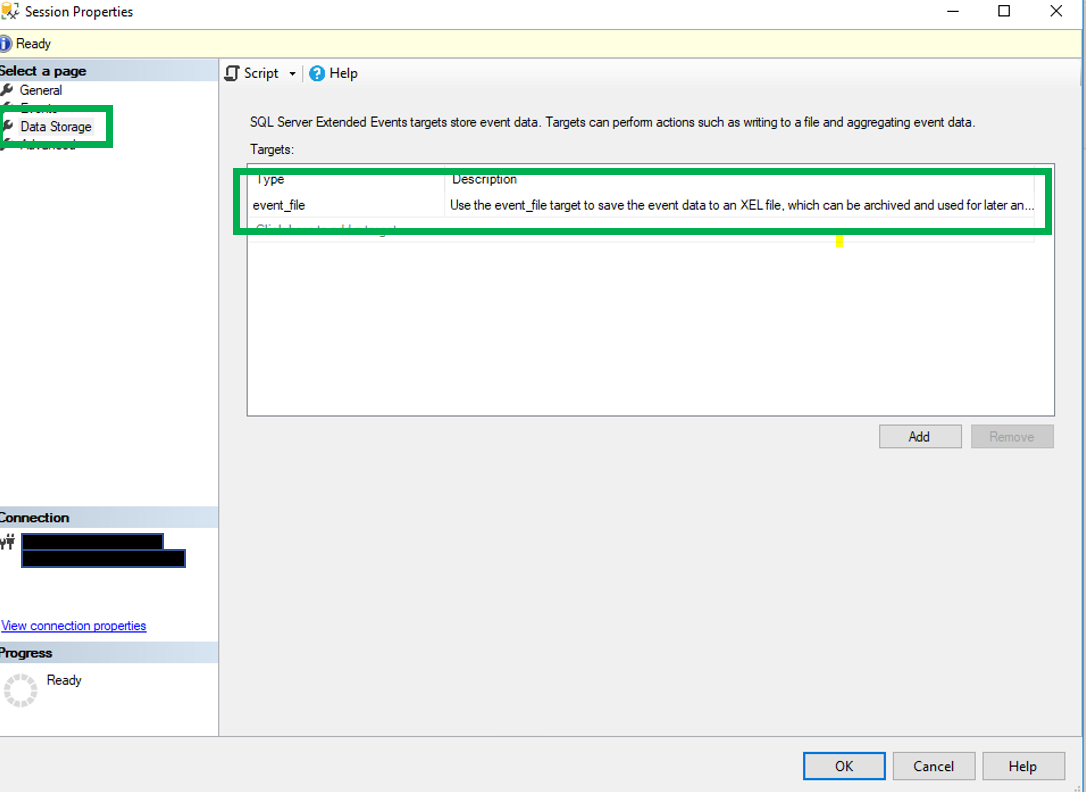
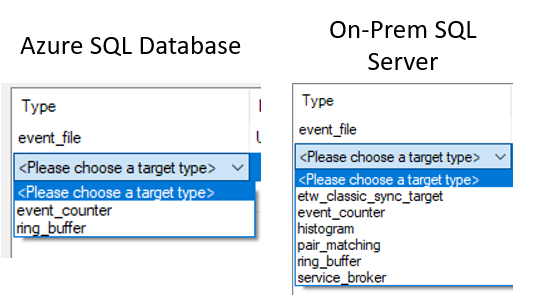
When you use Extended Events you will need to provide a target type. A target is nothing more that a location that will store the event information. With both an on-prem instance of SQL Server and an Azure SQL Database you have several options to chose from. Below you will find the options for targets for both an Azure SQL database, on the left, and an on-prem instance of SQL Server, on the right. As you can see you have more options with the on-prem instance. While the focus of this post is how to read an Extended Events file, it is good to know the different options that are available.
 When storing the data in a file target, the file extension will be an .xel extension. This file type is an XML based document type. Normally you can open an XML document using notepad and it will still be in a readable format. That is not the case here. As you can see by the image below, there really isn’t much that is readable in an XEL file type.
Setting up an Azure Storage Account
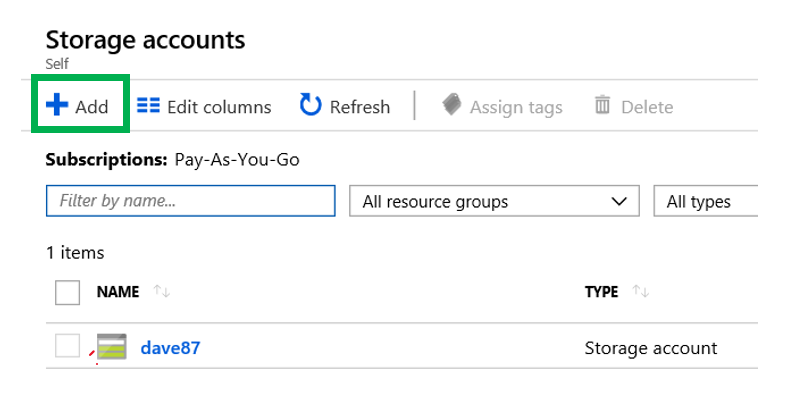
Now that we have reviewed a bit about what Extended Events are and what the file target is. Now we need to go over how do you create the actual target files. The first thing we need is a destination location. For an on-prem SQL Server this can be a local drive, a network share or a mapped SAN connection. These are not really the best options for an Azure SQL Database. This is where an Azure Storage Account is going to be our friend.
Once you have located it, click “Storage Accounts” . This will bring you to the screen below.
 When you click the “Add” button you will be taken to a page that will allow you to enter all the appropriate information to create the storage account.
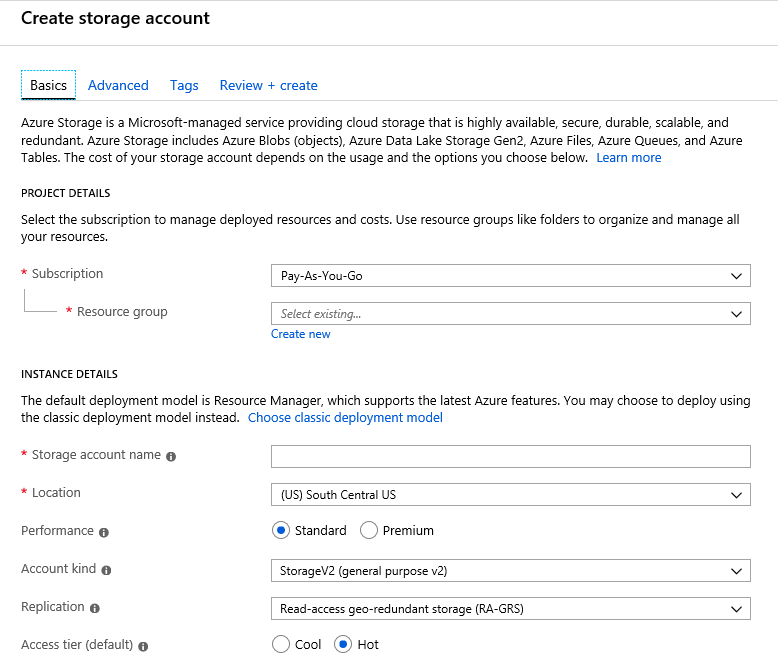
As you can see by the above screenshot, you will be asked for much of the expected information. This includes the account name, subscription, resource group as well as location. When deciding on a location, it is important to chose this carefully. Remember by picking a location that is a different location could lead to additional unexpected charges. Please double check with your Microsoft representative to assure this does not happen.
While this post really isn’t about how to create an Azure storage account, I did want to at least provide some basics. One thing I do want to point out, the Access tier you see at the bottom of the image above.
As you can see there are two options, Cool and Hot. Below you will find the definitions as stated in Microsoft’s documentation here.
-
- Hot – Optimized for storing data that is accessed frequently.
- Cool – Optimized for storing data that is infrequently accessed and stored for at least 30 days.
This MS site also gives a good, more detailed explanation on the differences between the two.
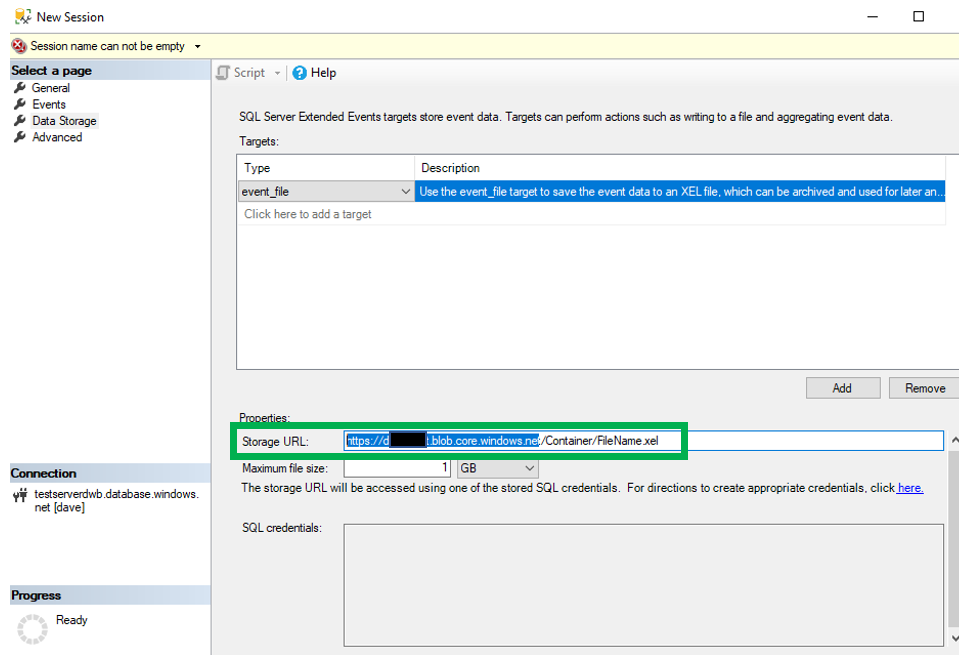
Setting up the File Target to an Azure Storage Account
Now that we have our storage account in Azure we now need to set up everything so it can be used as a target for the Extended Event session. With both the on-prem and Azure instances of SQL Server, there are multiple options when configuring a Extended Event target.
How To Read the Data
As you can see above, the file target really isn’t readable with Notepad or any other text editor. With that, we need another tool to read the data we have collected. For an on-prem SQL Server, you have several options. You can use the GUI in SQL Server Management Studio or you can use T-SQL.
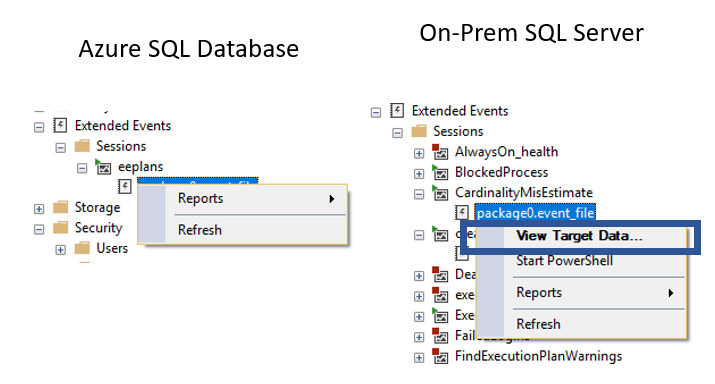
When you the GUI in SSMS, you will navigate to the Extended Event session and simply right click on the file target. When you do you will see an option to view target data.
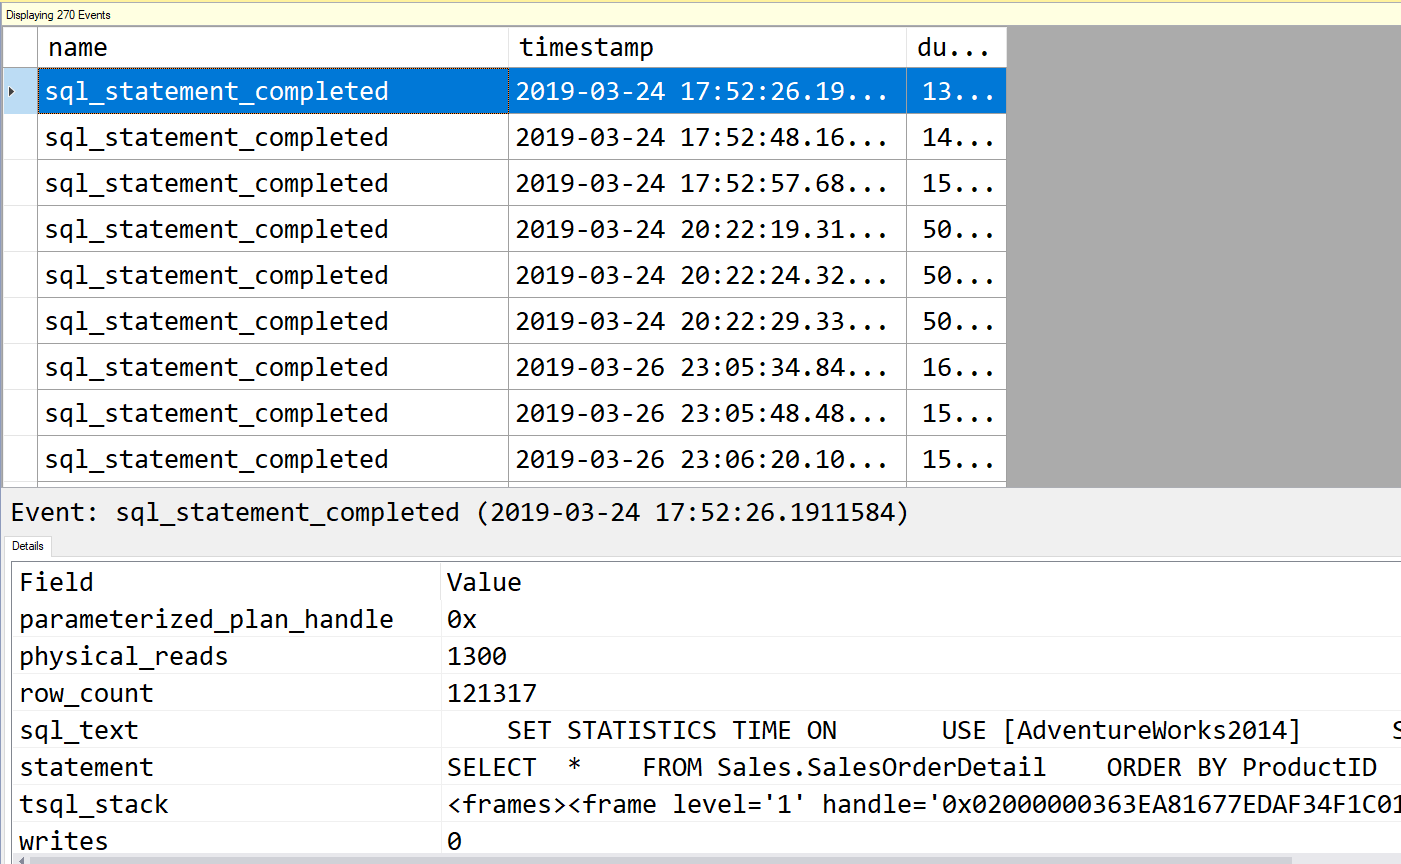
When you click, you will see something similar to what is in the image above. In this GUI, you can sort, group and even export the data. I really like this for analyzing the event data. However, this is not an option for an Azure SQL Database. When you right click on the target in an Azure SQL database there is not an option to view target data. Below you can see the results of right clicking on the target. Notice that the Azure SQL Database does not have an option to “View Target Data”.
The other option is to use T-SQL. This is an option for both Azure SQL Database and an on-prem instance of SQL Server. Luckily the code requires very little modification to move from using it on-prem to using on an Azure SQL Database. Because T-SQL will work in both Azure SQL Database and an on-prem instance of SQL Server, we will focus this blog post how to use T-SQL to extract and review your event data.
When reading from the XEL file in an Azure Storage account, there are few prerequisite items that we need to briefly cover as well.
fn_xe_file_target_read_file
The XEL file is an XML based file so when reading the data you will need to parse through the XML. In order to do this, we can use the sys.fn_xe_file_target_read_file function. This function has a total of four arguments. Here is the link to Microsoft’s documentation on this function.
-
-
- Path – this is the path to the XEL file(s)
- mdpath – this is the metadata file path. Starting with SQL Server 2012, this is no longer needed and NULL can be used
- initial_file_name – this specifies the first file to read from, if NULL all files will be read
- initial_offset – per Microsoft documentation this is “Used to specify last offset read previously and skips all events up to the offset (inclusive)”
Below is an example of how the initial step in reading the XEL file might look. Notice the four arguments and that the only one without NULL as a value is the first one.
SELECT event_data = CONVERT(xml, event_data)
INTO #eeTable
FROM sys.fn_xe_file_target_read_file(
‘C:\eefiles\efiles_0_132002087635590000.xel’,null, null, null);
Hopefully you also noticed that the SELECT converts the event_data column to XML. This is just the first step, later we will discuss how to parse the resulting XML into a more readable format.
Azure Storage Explorer
When reading from an Azure Storage account, instead of using the usual path to a drive or a UNC, you will use a URL instead.
SELECT event_data = convert(xml, event_data)
FROM sys.fn_xe_file_target_read_file(
‘https://StorageAccountName.blob.core.windows.net/eefiles/efiles_0_132002087635590000.xel’,null, null, null);
When first looking at this, you would expect that when given the proper credentials, you would not have any issues reading from the file. Well, you don’t get an error, but you also do not get any data even though the file you are trying to read from does indeed exist.
The reason for this is because you will need to create a credential in the Azure SQL Database that the Extended Event is in. This is where the Azure Storage Explorer will come in handy.
When you create the credential, you will need the “Secret”. This is a Shared Access Signature code that will look something like this.
?st=2019-05-18T12%3A52%3A56Z&se=2019-05-19T12%3A52%3A56Z&sp=rl&sv=2018-03-28&sr=c&sig=rUriw3oYKU%2BtqK9Ji5oq6Ih34i0uHe34ldorjfnQgUM%3D
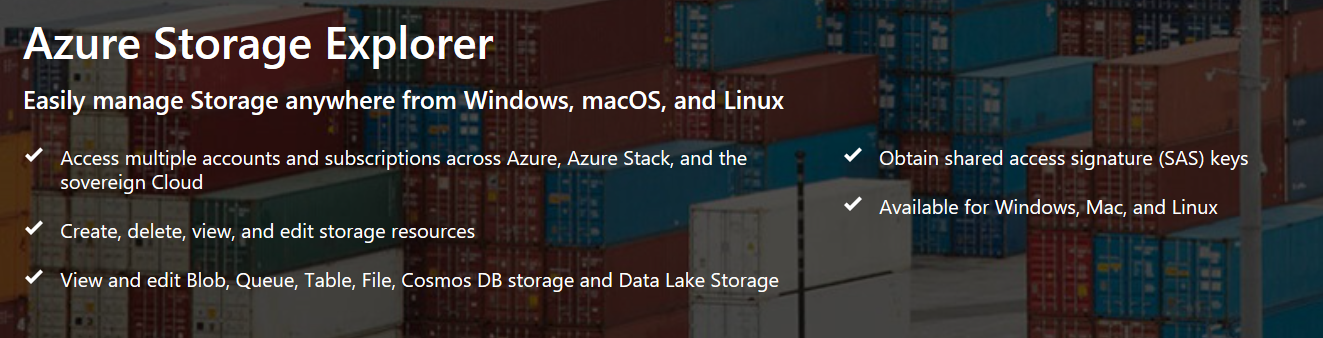
You can use the Azure Storage Explorer to get this. The Azure Explorer can be downloaded here. It also has a great price, FREE!! Per Microsoft, Azure Storage Explorer offers the following features.
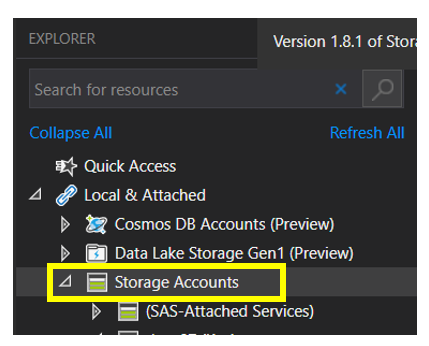
Once you have installed and opened Azure Storage Explorer, you will then need to connect to your Azure Storage Account. You can do this by expanding the tree and right clicking on “Storage Accounts” and then clicking “Connect to Azure Storage…”
When you will see the form you see below. As you can see there are a number of methods you can use to connect to your Storage Account.
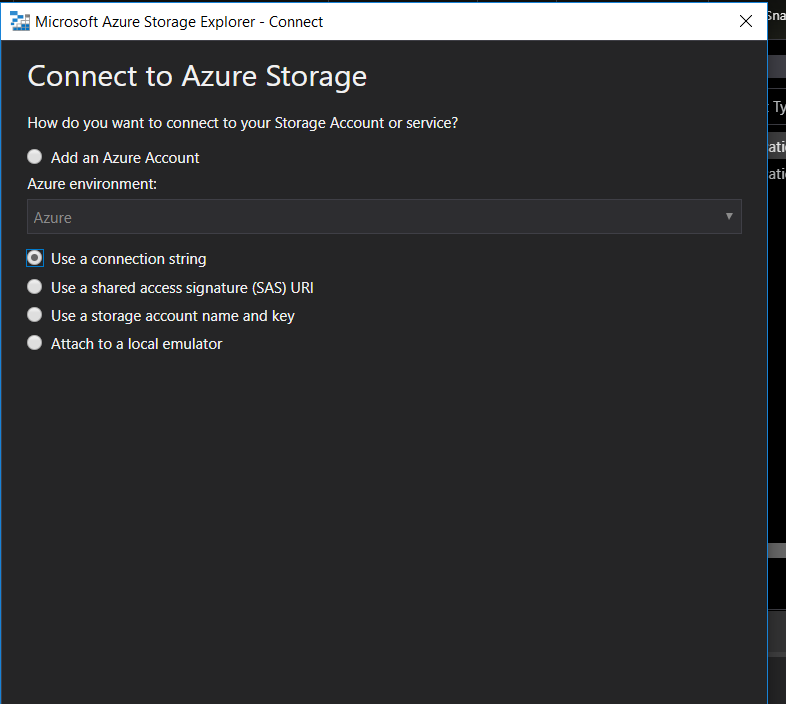
For this post, I used the “Use a connection string” option. In order to get the connection string you will need to navigate to the Azure Portal. Once there proceed to your storage account can click “Access Keys”.
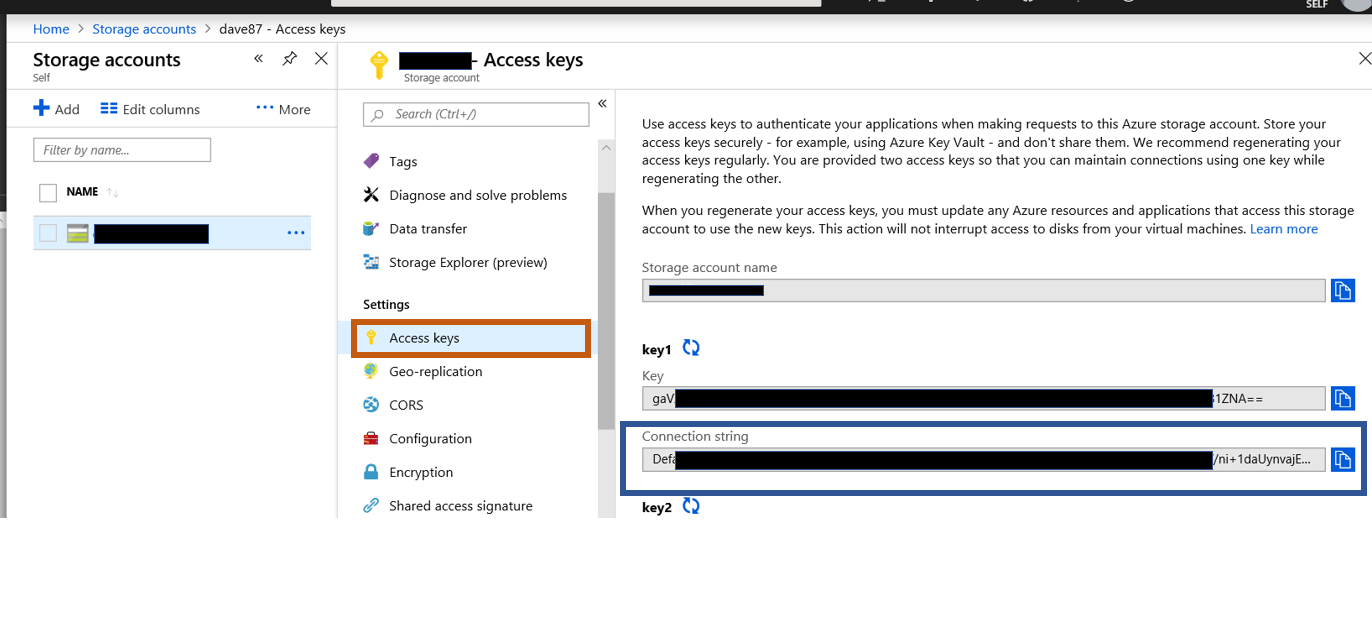 Once you can see the Connection string, simple click the “Copy” button to the right of the string. As expected, this will place the connection string on your clipboard.
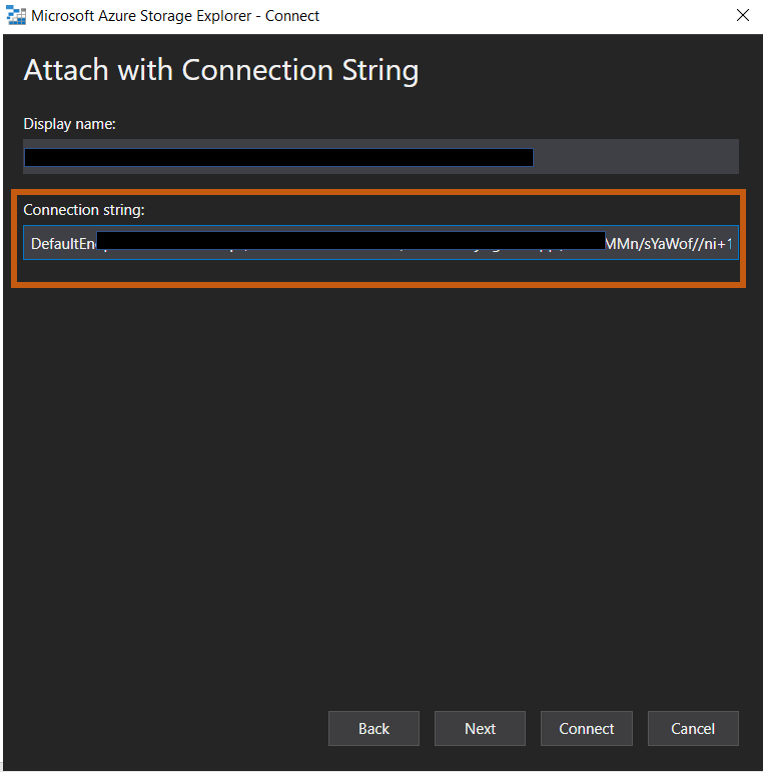
When you paste the connection string into the above form, Azure will automatically populate the Display Name box. Then you click “Next” where you will then see a summary form. At this point, you will review and click “Connect”.
You will need to create a Blob Container. This is pretty simple, just right click on “Blog Containers” and go to Create.
Now we have everything we need to get the last piece of information we need in order to utilize T-SQL to query the Extended Events .xel file. This last bit of information is the Shared Access Signature. You will need this to create the require Azure SQL Database credential.
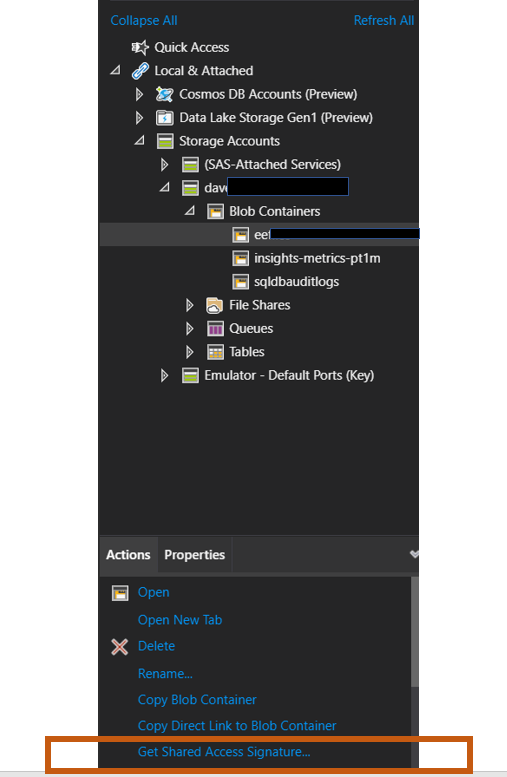
Once you are connected to your storage account, navigate to the blog storage and click on it. When you do, you will see “Actions” and “Properties” toward the bottom, click “Actions” and then click “Get Shared Access Signature…”.
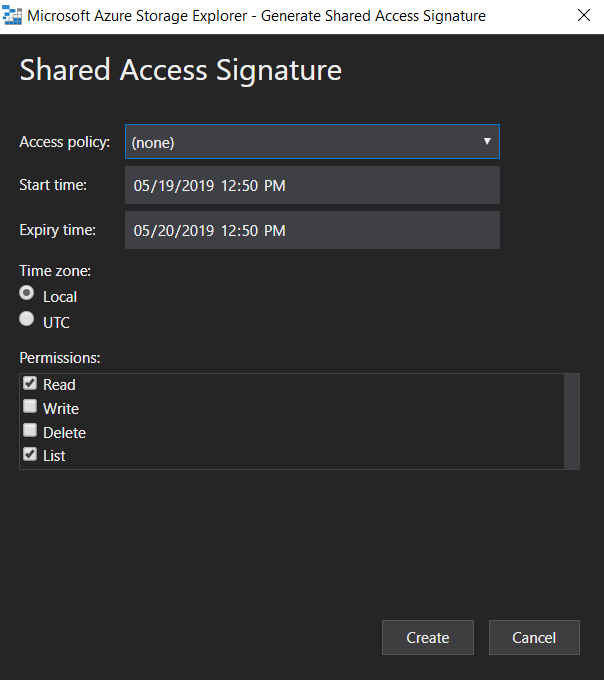
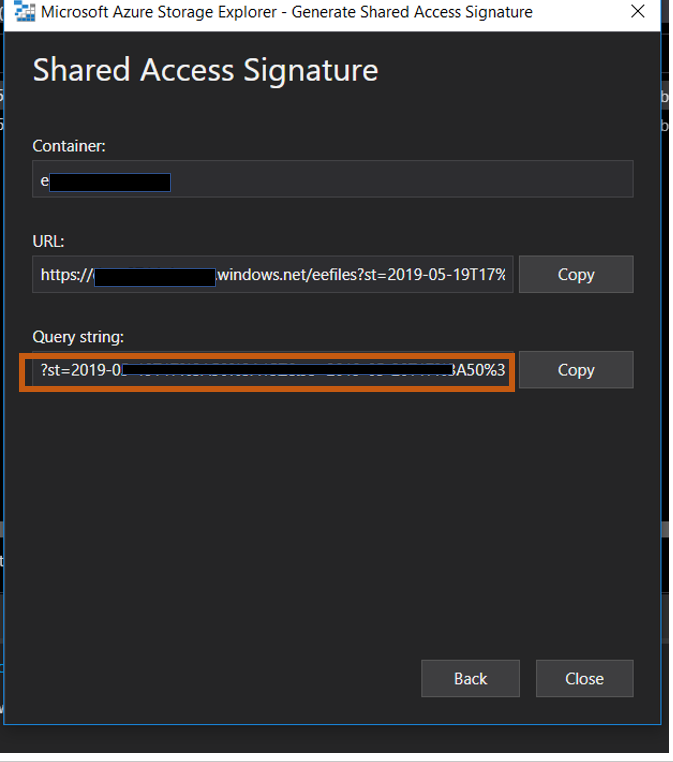
As you can see the form that will pop up will have a number of options. Given the this post is about how to read from the files, we will not change anything here. At this point, click “Create”. The following form will then appear. Notice there three data points.
-
-
- Container
- URL – You will need this, well at least part of it
- Query String: You will also need this to read the files
Now that we have completed the following prerequisites to utilize Azure Storage account to store the Extended Events files, we are ready to begin working on the T-SQL code.
These prerequisites included the following.
-
-
- Created an Azure Storage account
- Created a blog container
- Downloaded and installed Azure Storage Explorer
- Connected the Storage Explorer to the Azure Storage Account
- Created the Shared Access Signature
Create Credential
This first step when using T-SQL to read Extended Files that are stored in an Azure Storage Account is to create a database credential. Of course the credential will provide essential security information to connect to the Azure Storage Account. This first data point you will need is the URL to a blog storage container in your storage account. If you look below, you can see where you would place your storage account name and the blob storage container name.
CREATE DATABASE SCOPED CREDENTIAL [https://StorageAccount.blob.core.windows.net/blobstorage]
WITH IDENTITY=‘SHARED ACCESS SIGNATURE’
, SECRET = ‘st=2019-04-19T22%3A15%3A13Z&se=2020-04-20T22%3A15%3rtieo34=rwdl&sv=2018-03-28&sr=c&sig=ubWCJk3RvUrkeitpe,wdig3h56F5CM%3D’
GO
Because this is a database level credential, it is important to execute the code in the context of the database you are attempting to run the code to read the files from.
The “WITH IDENTITY” will always be “Shared access Signature” with the type of connection we are going to use. Finally we get to the SECRET, this is the connection string we created earlier.
When you first create the connection string it will look something like this. It will be much longer that what is here. I removed many of the characters for security reasons.
?st=2019-04-19T22%3A15%3A13Z&se=2020-………..
Prior to using this string, you will need to make one minor adjustment. You need to remove the question mark from the beginning. You can keep it when you create the credential, in fact the credential will be created. However, it will not work. When you attempt to read the file, no error will be generated, you just wont see any results.
If you find that you need to delete the credential, you can use the code below with a few adjustments. Those adjustments are in italics.
DROP DATABASE SCOPED CREDENTIAL [https://storageAccountName.blob.core.windows.net/BlobContainerName]
If you attempt to read the data from the EE files, and the credential does not exist you will see the error. Given this, it is vital that the credential get created in the proper database
Msg 262, Level 14, State 1, Line 1
CONTROL permission denied in database ‘master’.
Msg 297, Level 16, State 1, Line 1
The user does not have permission to perform this action.
Now that the database credential exists, you can now run the code below to query the data.
SELECT event_data = CONVERT(xml, event_data)
INTO #eeTable
FROM sys.fn_xe_file_target_read_file(
— TODO: Fill in Storage Account name, and the associated Container name.
‘https://StorageAccountname.blob.core.windows.net/BlogContainerName/FileName.xel’,
null, null, null
);
SELECT
ts = event_data.value(N'(event/@timestamp)[1]’, N’datetime’),
[sql] = event_data.value(N'(event/action[@name=”sql_text”]/value)[1]’, N’nvarchar(max)’),
duration = event_data.value(N'(event/data[@name=”duration”]/value)[1]’, N’nvarchar(max)’),
spid = event_data.value(N'(event/action[@name=”session_id”]/value)[1]’, N’int’),
user_nm = event_data.value(N'(event/action[@name=”username”]/value)[1]’, N’nvarchar(max)’),
dbname = event_data.value(N'(event/action[@name=”database_name”]/value)[1]’, N’nvarchar(max)’),
explan = event_data.value(N'(event/data[@name=”showplan_xml”]/value)[1]’, N’nvarchar(max)’)
FROM #eeTable
ORDER BY ts
DROP TABLE #eeTable
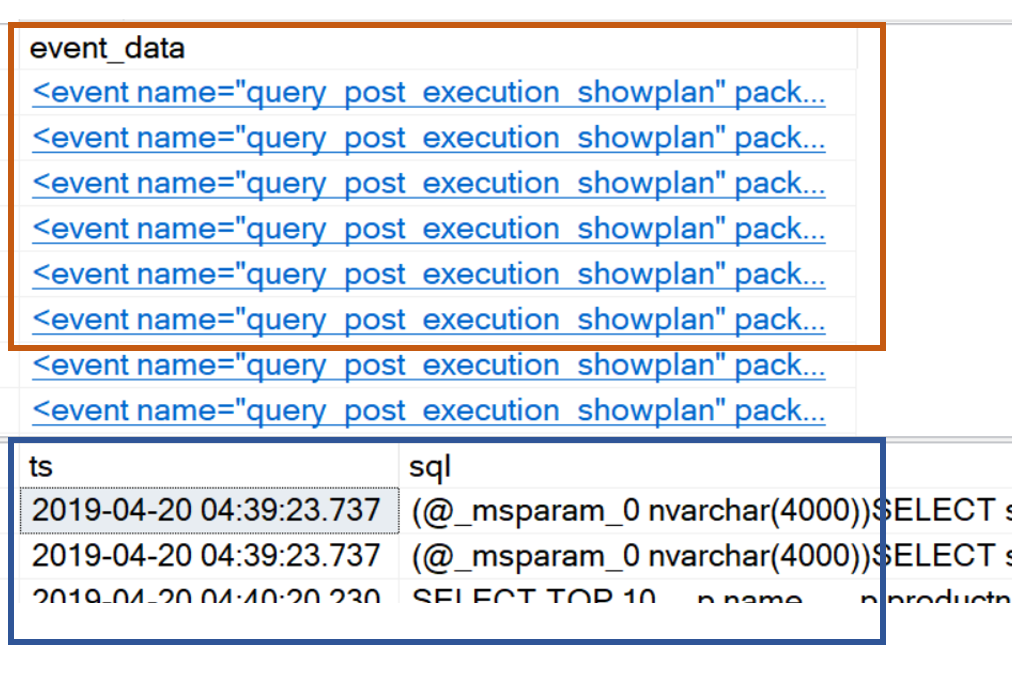
This code does a number of things. First of all it reads the file and converts the results to a single XML data row for each row in the file.
Then after dumping the results into a temporary table, the code then parses the XML and returns it in a more readable relational table type format. When you look at the image below you will see two results. The top set, in the red box, is the converted XML. The second set, in the blue box is the XML parsed to the more traditional columns we are used to working with.
 Now, once in the columns, we can do what ever T’SQL will allow us to do. For example, insert the results into a disk based table for analysis at a later date.
One thing I would like to point out is the two bits of code below.
When the column name is taken from the Global Fields tab in the Extended Event session you will use “event/action” followed by the column name.
event/action[@name=”sql_text”
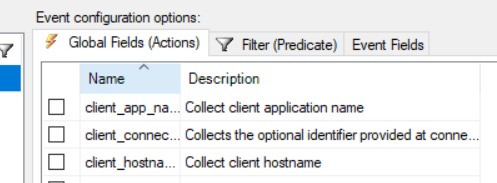
When the column name is taken from the Event Fields tab in the Extended Events sessions, you will use “event/data” followed by the column name.
event/data[@name=”duration”
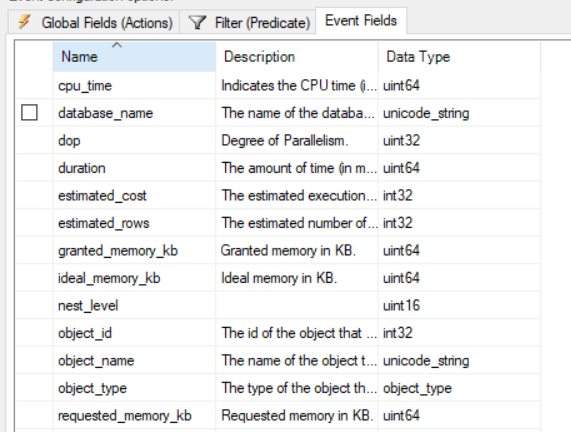
On thing to keep in mind, if you spell the column name incorrectly, it will not throw an error. It will simply return NULL in every row for that column.
Question…
As I was writing this I realized that there a lot of steps. The question that came to my mind that there has to a way with less steps. The answer to that question is, there is.
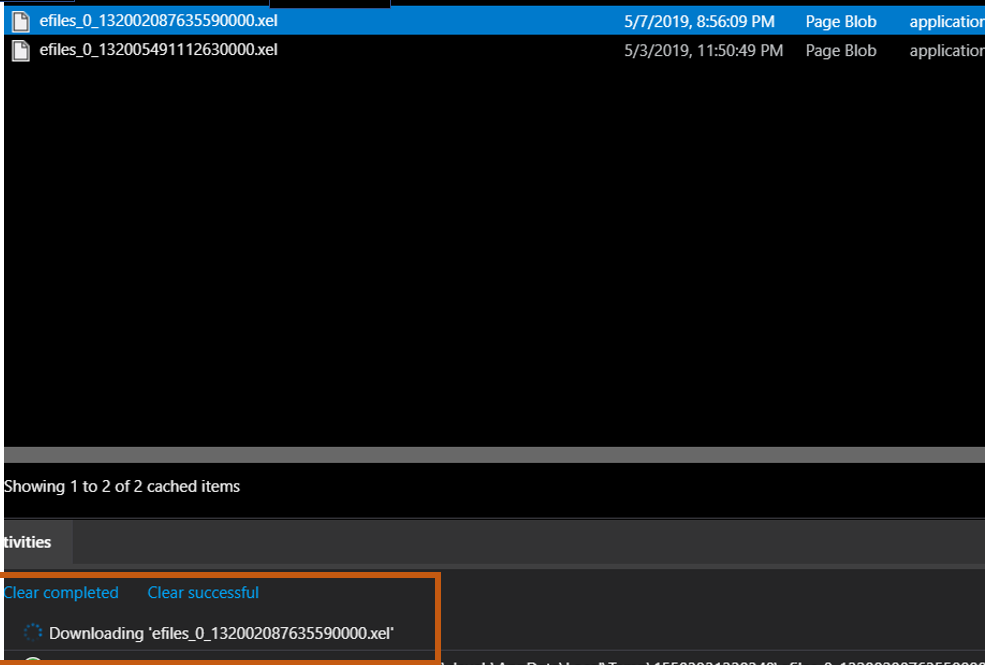
If you right click on the file in the Azure File Explorer, you can then click open. When you do you will see the file downloading as you see in the red box below.
Once it has completed downloading and is ready to open, you may see this warning.
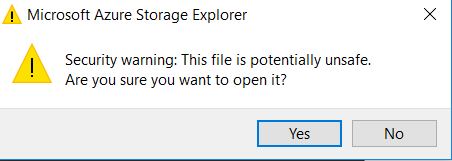
If you do, proceed with caution. I believe you see this is because of the file format. However, again, please proceed with caution.
When you click “Yes”, SQL Server Management Studio will then open and display the data as below.
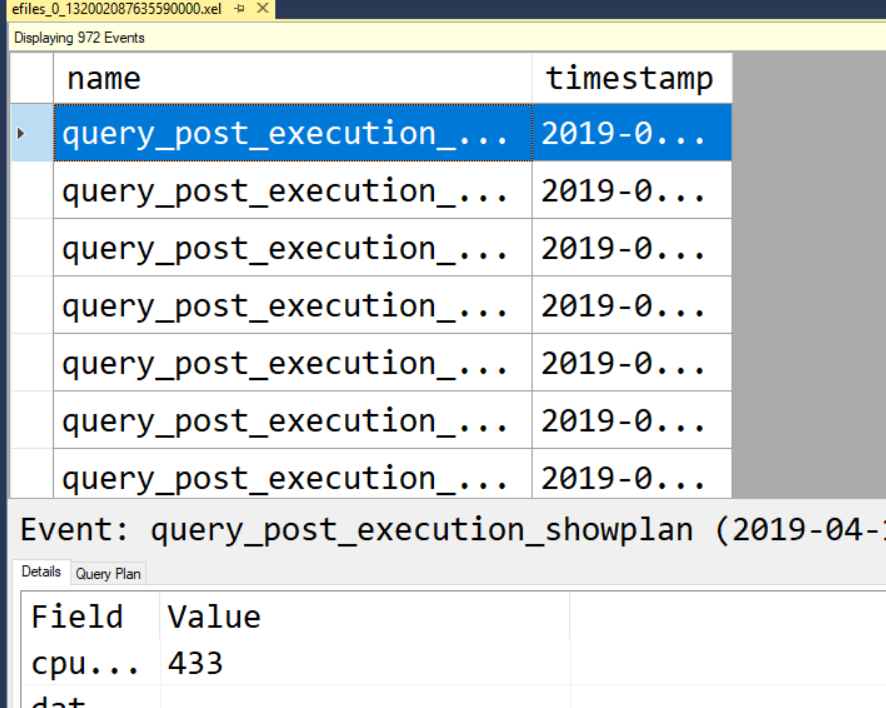
Once you have the data in SSMS, all the functionality that comes with it is now available. This includes the ability to export the data to a table, group the data, apply filters and sort the data as well.
If I was just reading the data, this is the way to go. However, if I needed to automate the collection of the, I will need to use the T_SQL method mentioned in most of the post.
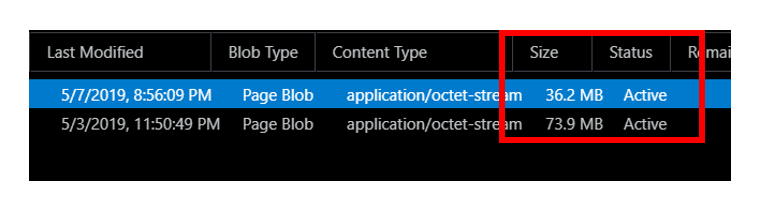
Another thing to keep in mind is the amount of date you will be pulling out of your Azure Storage Account. As you can see in the image below, the Extended Events files can get quite large.
 In order to avoid large bills on your Azure subscription, it is important to understand the impact of opening large files. It can get expensive if not managed carefully.
Hopefully you are still here……it was a long post. By far the longest I have written. If you are still here….thank you for stopping by my blog!!!